

NCERT Solutions For Class 3 Maths Chapter 13 - Smart Charts
Smart Charts deals with the concept of data handling. This chapter have exercises on recording data using tally marks, drawing conclusion from recoded data, representing data using pictographs. The solutions for Math-Magic Chapter-13 have been created and verified by our experienced subject matter experts, according to the CBSE syllabus and guidelines of NCERT. For practice, our subject matter experts have created very interactive, activity-based, and Image-based worksheets on these topics to enhance learning. The NCERT Solutions of Math-Magic for Class-3, Chapter-13: Smart Charts in PDF format can be downloaded for free Click here.
Download PDF For NCERT Solutions for Maths Smart Charts
The NCERT Solutions For Class 3 Maths Chapter 13 - Smart Charts are tailored to help the students master the concepts that are key to success in their classrooms. The solutions given in the PDF are developed by experts and correlate with the CBSE syllabus of 2023-2024. These solutions provide thorough explanations with a step-by-step approach to solving problems. Students can easily get a hold of the subject and learn the basics with a deeper understanding. Additionally, they can practice better, be confident, and perform well in their examinations with the support of this PDF.
Download PDF
Access Answers to NCERT Solutions For Class 3 Maths Chapter 13 - Smart Charts
Students can access the NCERT Solutions For Class 3 Maths Chapter 13 - Smart Charts. Curated by experts according to the CBSE syllabus for 2023–2024, these step-by-step solutions make Maths much easier to understand and learn for the students. These solutions can be used in practice by students to attain skills in solving problems, reinforce important learning objectives, and be well-prepared for tests.
What Do We See on the Road?
Can a horse without a rider come in this smart chart?
A horse without a rider cannot come in this smart chart because this chart shows the different ways of travelling. A horse without a rider is an animal not a mode of travelling.
Answer the following questions.
- In the picture which way of travel do you see the most?
- Which way of travel (vehicle) do you see the least?
- The number of people walking is more than the number of ______
- The number of buses is less than the number of________
- In the given picture 17 four-wheelers can be seen, that is the highest number. Therefore, four-wheelers are the most preferred way of travelling.
- In the picture only one bullock cart can be seen, that is the least number. Therefore, bullock cart is the least preferred way of travelling.
- From the given picture, 5 people are walking and 4 people are traveling by bullock cart. Therefore, the number of people walking is more than the number of bullock carts.
- From the given picture there are 4 buses and 5 people are walking. Therefore, the number of buses is less than the number of people walking.
Look at the traffic scene in the picture and fill in the table.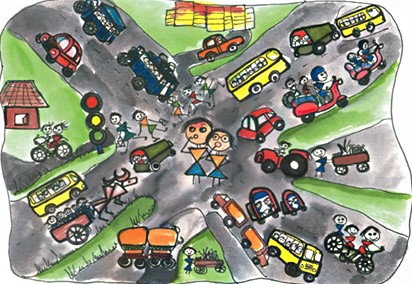
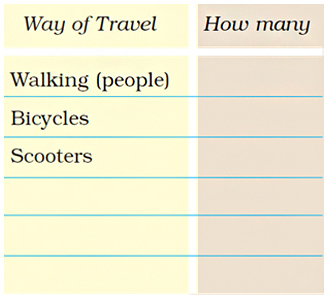
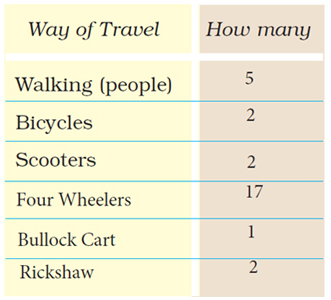
Observe the given picture and count the different ways of travel used by people. The correct answer is:
How Many Times Do You Get 6?
Have you played any games with dice? How many dots are there on the different faces of a die?
Answer it by yourself. There are many games that are played with dice. One example is Ludo.
There are 1, 2, 3, 4, 5, and 6 dots, respectively on different faces of a dice.
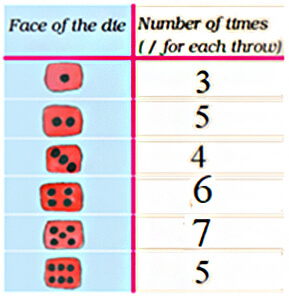
Now fill in the table: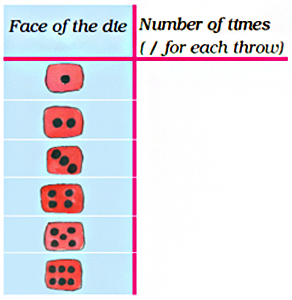
a) Which face of the die did you get the most number of times?
b) How many times  did come up?
c)  came up more times than_______
Do it by yourself. Throw a dice 30 times and note the numbers you get. Write them in the table and then answer the questions. A sample answer is.
- Five came up the most number of times.
- Six came up 5 times.
- Four came up more times than six.
- Do it by yourself.
Find out from People Around You
Ask your friends about the number of people living in their homes. Fill in the table.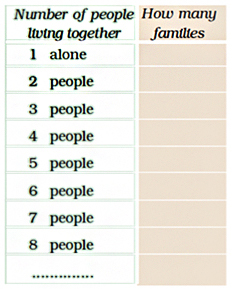
a) Most families have ______ people living in their homes.
b) The smallest number of people living in a home is_________
c) The number of families having 4 people is___________
Do it by yourself. Answers may vary. Ask your friend about the number of people living in their home. Fill up the data in the given chart. Answer the given questions based on their response.
What have your classmates brought for lunch today? Find out and note down.
a) Food item brought for lunch by the biggest number of students ___
b) Food item brought by the smallest number of students______
Do it by yourself. Answers may vary. A sample is: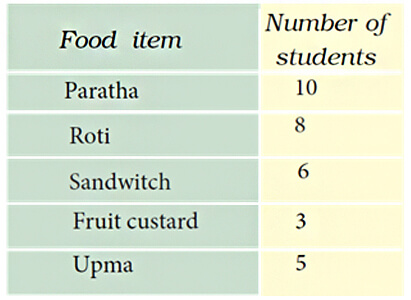
- Since 10 students brought parathas, that is the largest number in the data. Therefore, paratha was brought by the biggest number of students for their lunch.
- Since 3 students brought fruit custard, that is the least number. Therefore, fruit custard was brought by the smallest number of students.
Talk to people around you about their favourite sweets.
Fill in the table:
From the above table answer the following:
a) Most favourite sweet__________
b) Least favourite sweet__________
c)____ is liked more than _________
d)____is liked more than__________
e)____ is liked more than__________
f)____ is liked more than__________
Do it by yourself. Talk with the people around you about their favourite sweets and note down the details in the given chart. Answers may vary. A sample answer is: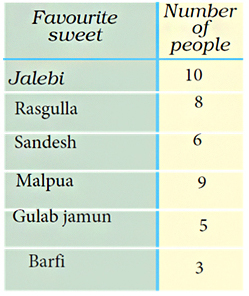
a)Since jalebi is liked by 10 people, if is the highest number. The most favourite sweet is Jalebi.
b) Since barfi is liked by only 3 people, it is the least number. The least favourite sweet is Barfi.
c) Gulab Jamun is liked more than Barfi.
d) Jalebi is liked more than Rasgulla.
e) Malpua is liked more than Gulab jamun.
f) Sandesh is liked more than Barfi.
Getting Smart with Charts
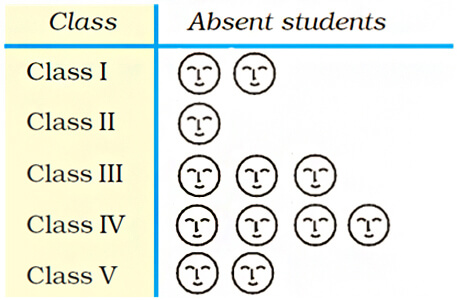
This is a chart to show the number of absent students. Each absent student is shown by .
In the chart show the absent students of Class V. Now look at the chart and fill in the blanks:
a) The class with the highest number of absent students is_______
b) The class with the least number of absent students is________
c) The class with 3 students absent is____________.
d) The number of students absent in Class IV and Class V are_______ and_________.

Since there are 2 students absent in class V, draw 2 faces for class V in the chart to represent 2 students.
- There are 4 faces for class IV, that is the highest number in the chart. Therefore, the class with the highest number of absent students is class IV.
- There is 1 face for class II, that is the least number in the chart. Therefore, the class with the least number of absent students is class II.
- There are 3 faces for class III in the chart. Therefore, the class with 3 students absent is class III.
- Number of faces for class IV and V are 4 and 2 respectively. Therefore, the number of students absent in Class IV and Class V are 4 and 2.
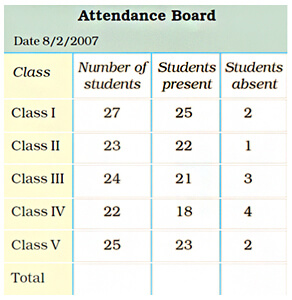
This board shows the number of students in each class. It also shows the number of students present and absent.
a) How many children in all are there in the school?
b) How many children in all are absent on that day?
- To find the total number of children in the school, add all the numbers in the column ‘Number of students’ column.
27 + 23 + 24 + 22 + 25 = 121
Therefore, there are 121 children in the school altogether. - To find the total number of children absent on that day, add all the numbers in the ‘Students absents’ column.
2 + 1 + 3 + 4 + 2 = 12
Therefore, 12 students were absent on that day.
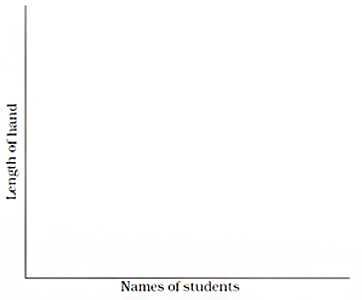
How Long is Your Hand?
In the chart below stick the strips of all the friends in your group. Keep some space between the strips.
Do it by yourself as directed.
Make a group of 4 friends. Cut strips from waste paper. The strips should be of the same width. Measure the length of each student's hand with the paper strip. Cut the strip and write the name of the student.
Do it by yourself as directed.
Rohan, Jacob and Geeta also measured their hands. They stuck their strips as shown.
Look at the picture and fill in the blanks:
a) The length of Jacob's hand is__________ (more/less) than Geeta's hand.
b) The length of Geeta's hand is __________ (more/less) than Rohan's hand.
c)___________ has the longest hand.
d)___________ has the shortest hand.
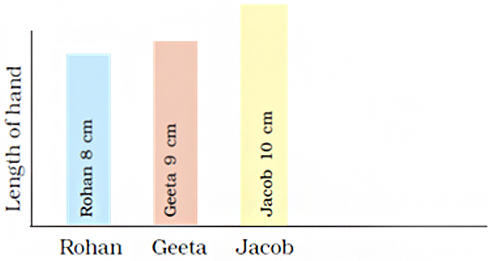
Observe the height of strips in the given picture.
- Since the strip for Jacob is higher than the strip for Geeta, the length of Jacob's hand is more than Geeta's hand.
- Since the strip for Geeta is higher than the strip for Rohan, the length of Geeta's hand is less than Rohan's hand.
- Since the strip for Jacob is the highest, Jacob has the longest hand.
- Since the strip for Rohan is the shortest, Rohan has the shortest hand.
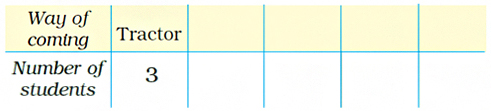
Children Coming to School
Draw faces in the chart to show how many children come by bus, bicycle, etc.
Answers may vary based on the previous answer. The correct answer based on the given previous answer is:
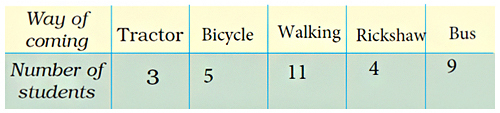
Fill in the blanks:
a) The most students come to school by_________.
b) The number of students walking to school is________
(more/less) than the students coming on bicycle.
c) The least students come to school by____________.
Observe the chart in the previous answer.
- Since the greatest number of faces are drawn for the students who come to school by walking, It can be said that the most students come to school by walking.
- Since the greatest number of faces are drawn for the students who come to school by walking, the number of students walking to school is more than the students coming on bicycle.
- In the given picture, only one student comes to school by horse. Therefore, the least number of students come to school by horse.
Look at the picture and fill in the table.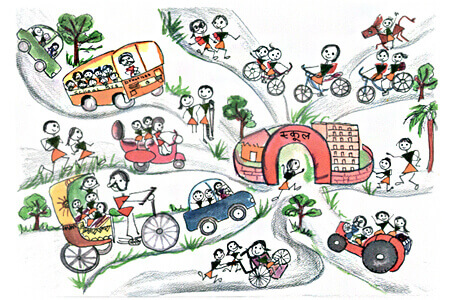
Do it by yourself. Answers may vary. A sample answer is:

Practice Time
Make your own smart charts about the things around you. Like:
Which bird has the most colours?.jpg)
Which animal is liked most as a pet?.jpg)
Do it by yourself. Collect the data for the number of colours in birds around you, pet animals etc. and create your own smart charts.
A Vegetable You Do Not Like!
Which vegetable is most disliked? Ask your friends and complete the table.
Do it by yourself as directed. A sample answer is:

Use this table to draw faces in the chart below. Draw for each child on top of the vegetable disliked.
a) The most disliked vegetable is__________.
b) The vegetable disliked by very few children is_________.
Answers may vary based on the answers for the previous question. The correct answer based on the sample answer in the previous question is: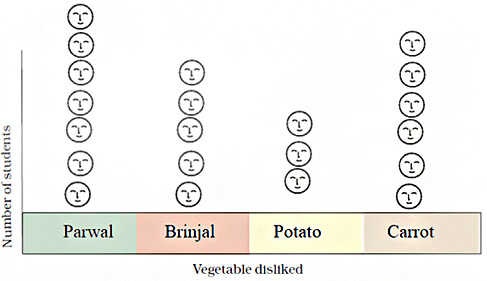 a) The most disliked vegetable is parwal.
b) The vegetable disliked by very few children is potato.
Flowers of Different Colours
Draw the right flower. Write how many there are.
a) ________ are the most in number. How many?
b) ________ are the least in number. How many?
c) ________ are more than______
d) ________ are more than______
Since there are 9 blue flowers, 7 red flowers, 5 orange flowers, and 10 purple flowers, the correct answers are:
a) The flowers that are most in number are purple flowers. There are a total of 10 flowers that are purple in colour.
b) The flowers that are list in number are orange flowers. There are a total of 5 flowers that are orange in colour.
c) Red flowers are more than orange flowers.
d) Blue flowers are more than orange flowers.
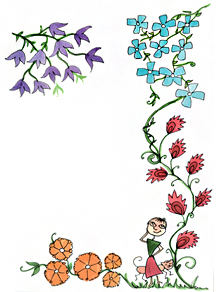
Look at the different flowers in the picture. Complete the table:
From the given picture, count the number of different coloured flowers and list down the numbers in the given table. The correct answer is.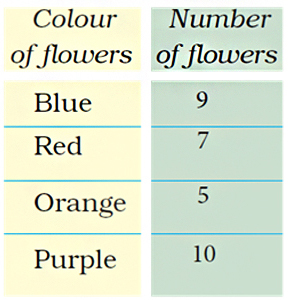
Frequently Asked Questions
The NCERT solution for Class 3 Chapter 13: Smart Charts is important as it provides a structured approach to learning, ensuring that students develop a strong understanding of foundational concepts early in their academic journey. By mastering these basics, students can build confidence and readiness for tackling more difficult concepts in their further education.
Yes, the NCERT solution for Class 3 Chapter 13: Smart Charts is quite useful for students in preparing for their exams. The solutions are simple, clear, and concise allowing students to understand them better. Smart Charts additionally, they can solve the practice questions and exercises that allow them to get exam-ready in no Smart Charts.
You can get all the NCERT solutions for Class 3 Maths Chapter 13 from the official website of the Orchids International School. These solutions are tailored by subject matter experts and are very easy to understand.
Yes, students must practice all the questions provided in the NCERT solution for Class 3 Maths Chapter 13: Smart Charts as it will help them gain a comprehensive understanding of the concept, identify their weak areas, and strengthen their preparation.
Students can utilize the NCERT solution for Class 3 Maths Chapter 13 by practicing the solutions regularly. Solve the exercises and practice questions given in the solution.