

NCERT Solutions for Class 8 Maths Chapter 5: Data Handling
The availability of NCERT Solutions for Class 8 Maths Chapter 5, Data Handling, is of paramount importance for 8th-grade students aiming to clarify any uncertainties and excel in their examinations.
Access Answers to NCERT Solutions for Class 8 Maths Chapter 5: Data Handling
Students can access the NCERT Solutions for Class 8 Maths Chapter 5: Data Handling. Curated by experts according to the CBSE syllabus for 2023–2024, these step-by-step solutions make Maths much easier to understand and learn for the students. These solutions can be used in practice by students to attain skills in solving problems, reinforce important learning objectives, and be well-prepared for tests.
Exercise 5.1
For which of these would you use a histogram to show the data?
(a) The number of letters for different areas in a postman’s bag.
(b) The height of competitors in an athletics meet.
(c) The number of cassettes produced by 5 companies.
(d) The number of passengers boarding trains from 7.00 a.m. to 7.00 p.m. at a station. Give a reason for each.
We know that a Histogram is a graphical representation of data if the data is represented using class interval.
Since the cases mentioned in options (b) and (d) can be divided into class intervals, the histogram can be used to show the data.
Similarly, since the cases mentioned in options (a) and (c) cannot be divided into class intervals, histograms cannot be used to represent the data.
The weekly wages (in ₹) of 30 workers in a factory are:
830, 835, 890, 810, 835, 836, 869, 845, 898, 890, 820, 860, 832, 833, 855, 845, 804, 808,
812, 840, 885, 835, 835, 836, 878, 840, 868, 890, 806, 840.
Using tally marks, make a frequency table with intervals as 800 – 810, 810 – 820 and so on.
The frequency table with intervals as 800 – 810, 810 – 820 and so on, using tally marks, is given below:

Draw a histogram for the frequency table made for the data in Question 3 and answer the following questions.
(i) Which group has the maximum number of workers?
(ii) How many workers earn ₹ 850 and more?
(iii) How many workers earn less than ₹ 850?

(i) 830-840 is the group having a maximum number of workers, 9, compared to other groups.
(ii) Workers earning ₹ 850 and more= 1+3+1+1+4=10
(iii) Workers earning less than ₹ 850= 3+2+1+9+5=20
The number of hours for which students of a particular class watched television during holidays is shown in the given graph.
Answer the following:
(i) For how many hours did the maximum number of students watch TV?
(ii) How many students watched TV for less than 4 hours?
(iii) How many students spent more than 5 hours watching TV?

(i) 32 students watched TV for 4-5 hours. ∴ The maximum number of students who watched TV for 4 – 5 hours.
(ii) The number of students who watched TV less than 4 hours= 22+8+4=34
(iii) The number of students who spent more than 5 hours watching TV
=8+6=14
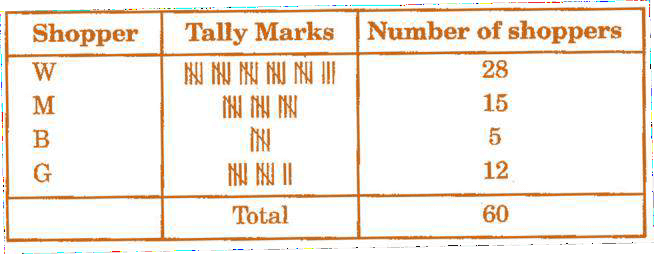
The shoppers who come to a departmental store are marked as man (M), woman (W), boy (B) or girl (G). The following list gives the shoppers who came during the first hour of the morning.
W W W G B W W M G G M M W W W W G B M W B G G M W W M M W W W M W B W G M W W W W G W M M W M W G W M G W M M B G G W.
Make a frequency distribution table using tally marks. Draw a bar graph to illustrate it.
Frequency distribution table:
Bar-graph:

Exercise 5.2
A survey was made to find the type of music that a certain group of young people liked in a city.
An adjoining pie chart shows the findings of this survey. From this pie chart, answer the following:
(i) If 20 people liked classical music, how many young people were surveyed?
(ii) Which type of music is liked by the maximum number of people?
(iii) If a cassette company were to make 1000 CDs, how many of each type would they make?

(i) 10% represents 100 people.
⟹20% represents = (100×20)/10 = 200
∴ 200 people were surveyed.
(ii) Since 40% of the total people surveyed liked light music and no other form of song was liked more than that, we can conclude that light music is liked by the maximum number of people.
(iii) CDs of classical music = (10 × 1000)/100 = 100
CDs of semi-classical music = (20 × 1000)/100 = 200
CDs of light music = (40 × 1000)/100 = 400
CDs of folk music = (30 × 1000)/100 = 300
A group of 360 people were asked to vote for their favourite season from the three:
seasons rainy, winter and summer.
(i) Which season got the most votes?
(ii)Find the central angle of each sector.
(iii) Draw a pie chart to show this information

(i) According to the table given in the question, the winter season got the most votes.
(ii) Central angle of summer season= (90×360)/360= 90o
Central angle of rainy season= (120×360)/360= 120o
Central angle of winter season= (150×360)/360= 150o
(iii)

Draw a pie chart showing the following information. The table shows the colours preferred by a group of people.

Here, central angle = 360o Total number of people = 36


The adjoining pie chart gives the marks scored in an examination by a student in Hindi, English, Mathematics, Social Science and Science. If the total marks obtained by the students were 540, answer the following questions.
(i) In which subject did the student score 105 marks?
(Hint: for 540 marks, the central angle = 360°. So, for 105 marks, what is the central angle?)
(ii) How many more marks were obtained by the student in Mathematics than in Hindi?
(iii) Examine whether the sum of the marks obtained in Social Science and Mathematics is more than that in Science and Hindi (Hint: Just study the central angles).


(i) The student scored 105 marks in Hindi.
(ii) Marks obtained in Mathematics = 135 Marks obtained in Hindi = 105 Difference = 135 – 105 = 30
Thus, 30 more marks were obtained by the student in Mathematics than in Hindi.
(iii) The sum of marks in Social Science and Mathematics = 97.5 + 135 = 232.5 The sum of marks in Science and Hindi = 120 + 105 = 225
∴ the sum of the marks in Social Science and Mathematics is more than in Science and Hindi.
The number of students in a hostel speaking different languages is given below. Display the data in a pie chart.


Exercise 5.3
List the outcomes you can see in these experiments.
(a) Spinning a wheel
(b) Tossing two coins together

(a) There are four letters A, B, C and D in a spinning wheel. So, there are 4 outcomes.
(b) When two coins are tossed together. There are four possible outcomes HH, HT, TH, and TT.
When a die is thrown, list the outcomes of an event of getting
(i) (a) a prime number
(b) not a prime number
(ii) (a) a number greater than 5
(b) a number not greater than 5
(i) (a) Outcomes of the event of getting a prime number are 2, 3 and 5.
(b) Outcomes of the event of not getting a prime number are 1, 4 and 6.
(ii) (a) Outcomes of the event of getting a number greater than 5 is 6.
(b) Outcomes of the event of not getting a number greater than 5 are 1, 2, 3, 4 and 5.
Find the.
(a) Probability of the pointer stopping on D in (Question 1-(a)).
(b) Probability of getting an ace from a well-shuffled deck of 52 playing cards.
(c) Probability of getting a red apple. (See figure below)

(a) In a spinning wheel, there are five pointers A, A, B, C, D. So, there are five outcomes. The pointer stops at D, which is one outcome.
So, the probability of the pointer stopping on D = 1/5
(b) There are 4 aces in a deck of 52 playing cards. So, there are four events for getting an ace.
So, the probability of getting an ace = 4/52 = 1/13
(c) Total number of apples = 7
Number of red apples = 4
Probability of getting a red apple = 4/7
Numbers 1 to 10 are written on ten separate slips (one number on one slip), kept in a box and mixed well. One slip is chosen from the box without looking into it. What is the probability of
(i) getting a number 6?
(ii) getting a number less than 6?
(iii) getting a number greater than 6?
(iv)getting a 1-digit number?
(i) Outcome of getting a number 6 from ten separate slips is one.
∴ probability of getting a number 6 = 1/10
(ii) Numbers less than 6 are 1, 2, 3, 4 and 5, which are five. So, there are 5 outcomes.
∴ probability of getting a number less 6 =5/10 = ½
(iii) Number greater than 6 out of ten that are 7, 8, 9, 10. So there are 4 possible outcomes.
∴ probability of getting a number greater than 6 = 4/10 = 2/5
(iv) One-digit numbers are 1, 2, 3, 4, 5, 6, 7, 8, 9 out of ten.
∴ probability of getting a 1-digit number = 9/10
If you have a spinning wheel with 3 green sectors, 1 blue sector and 1 red sector, what is the probability of getting a green sector? What is the probability of getting a non-blue sector?
A total of five sectors are present.
Out of the five sectors, three sectors are green.
∴ probability of getting a green sector = 3/5
Out of the five sectors, one sector is blue. Hence, non-blue sectors = 5 – 1 = 4 sectors
∴ probability of getting a non-blue sector= 4/5
Find the probabilities of the events given in Question 2.
When a die is thrown, there is a total of six outcomes, i.e., 1, 2, 3, 4, 5 and 6.
(i)
(a) 2, 3, 5 are the prime numbers. So, there are 3 outcomes out of 6.
∴ probability of getting a prime number =3/6 = ½
(b) 1, 4, 6 are not the prime numbers. So, there are 3 outcomes out of 6.
∴ probability of getting a prime number =3/6 = ½
(ii)
(c) Only 6 is greater than 5.
So there is one outcome out of 6.
∴ probability of getting a number greater than 5= 1/6
(d) Numbers not greater than 5 are 1, 2, 3, 4 and 5. So there are 5 outcomes out of 6.
∴ probability of not getting a number greater than 5= 5/6
Frequently Asked Questions
The NCERT solution for class 8 Chapter 5: Data Handling is important as it provides a structured approach to learning, ensuring that students develop a strong understanding of foundational concepts early in their academic journey. By mastering these basics, students can build confidence and readiness for tacking more difficult concepts in their further education.
Yes, the NCERT solution for class 8 Chapter 5: Data Handling is quite useful for students in preparing for their exams. The solutions are simple, clear, and concise allowing students to understand them better. Data Handling ally, they can solve the practice questions and exercises that allow them to get exam-ready in no time.
You can get all the NCERT solutions for class 8 Maths Chapter 5 from the official website of the Orchids International School. These solutions are tailored by subject matter experts and are very easy to understand.
Yes, students must practice all the questions provided in the NCERT solution for class 8 Maths Chapter 5 : Data Handling as it will help them gain a comprehensive understanding of the concept, identify their weak areas, and strengthen their preparation.
Students can utilize the NCERT solution for class 8 Maths Chapter 5 effectively by practicing the solutions regularly. Solve the exercises and practice questions given in the solution. Also, you can make Data Handling al notes and jot down the important concepts for your understanding.