

NCERT Solutions for Class 8 Science Chapter 5 – Coal and Petroleum
Orchid International School recognizes the importance of equipping young minds with knowledge about fossil fuels, their extraction methods, and the transition to more environmentally sustainable energy sources. This is why the CBSE has incorporated a chapter on coal and petroleum in the Class 8 Science curriculum. Chapter 5 delves into the vital subject of depleting non-renewable resources that play a pivotal role in our daily lives. Thus, Chapter 5 of the Class 8 Science curriculum holds great significance.
Download PDF For NCERT Solutions for Science Coal and Petroleum
The NCERT Solutions for Class 8 Science Chapter 5 – Coal and Petroleum are tailored to help the students master the concepts that are key to success in their classrooms. The solutions given in the PDF are developed by experts and correlate with the CBSE syllabus of 2023-2024. These solutions provide thorough explanations with a step-by-step approach to solving problems. Students can easily get a hold of the subject and learn the basics with a deeper understanding. Additionally, they can practice better, be confident, and perform well in their examinations with the support of this PDF.
Download PDF
Access Answers to NCERT Solutions for Class 8 Science Chapter 5 – Coal and Petroleum
Students can access the NCERT Solutions for Class 8 Science Chapter 5 – Coal and Petroleum. Curated by experts according to the CBSE syllabus for 2023–2024, these step-by-step solutions make Science much easier to understand and learn for the students. These solutions can be used in practice by students to attain skills in solving problems, reinforce important learning objectives, and be well-prepared for tests.
Coal and Petroleum
Name the petroleum product used for surfacing of roads.
Bitumen is the petroleum product used for surfacing roads.
Explain why fossil fuels are exhaustible natural resources.
Mineral oil is made from the dead remains of plants and animals that were buried in the ground millions of years ago under high temperatures and pressure, which cannot be synthesized in the laboratory. Therefore, fossil fuels are a completely natural resource.
Describe characteristics and uses of coke.
Coke is a substance produced by the destructive distillation of coal. It is a grey, hard and porous fuel with high carbon content and few impurities. It is used to make steel and metal extraction as a reducing agent.
What are the advantages of using CNG and LPG as fuels?
The advantages of using compressed natural gas (CNG) and liquified petroleum gas (LPG) as fuels is as follows:
-
They give a lot of heat energy when burnt as compared to other fuels like kerosene, coal, etc
-
They do not emit smoke when burnt, as they are clean fuels.
-
They have low prices.
-
They are easily available.
-
They can be easily transported by cylinders or pipelines.
Describe how coal is formed from dead vegetation. What is this process called?
Coal is made up of the remains of dead plants and animals buried in the ground, exposed to high temperatures and pressure in the absence of air. This process of the formation of coal is known as carbonization.
Fill in the banks.
a) Fossil fuels are ____ , ____ and _____.
b) Process of separation of different constituents from petroleum is called ____.
c) Least polluting fuel for vehicles is _____.
a) . Fossil fuels are coal, petroleum and natural gas.
b) . Process of separation of different constituents from petroleum is called refining.
c) . Least polluting fuel for vehicles is compressed natural gas (CNG).
Tick True/False against the following statements.
a) Fossil fuels can be made in the laboratory.
b) CNG is more polluting fuel than petrol.
c) Coke is almost pure form of carbon.
d) Coal tar is a mixture of various substances.
e) Kerosene is not a fossil fuel.
a) False. Fossil fuels are made from the remains of dead plants and animals buried inside the earth millions of years ago and exposed to high temperature and pressure conditions.
b) False. CNG is an eco-friendly fuel and safe to use as it does not cause any health issues. Therefore, it is very less polluting.
c) True. Coke is a fuel with few impurities and high carbon content. That is why it is an almost pure form of carbon.
d) True. Coal tar is a mixture of various substances such as dyes, paints, explosives, drugs, etc.
e) False. Kerosene is one of the products of the distillation of petroleum products.
Explain the process of formation of petroleum.
Petroleum is made up of dead plant and animal fossils buried in the ground millions of years ago under high temperatures and pressure in the absence of air the dead remains are broken into smaller units to form petroleum and natural gas.
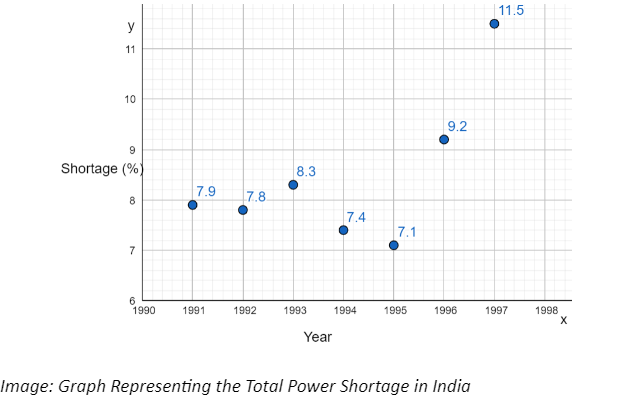
The following Table shows the total power shortage in India from
1991−1997
1991−1997
. Show the data in the form of a graph. Plot shortage percentage for the years on the Y-axis and the year on the X-axis.
|
S.No. |
Year |
Shortage ( % % ) |
|
1 1 |
1991 1991 |
7.9 7.9 |
|
2 2 |
1992 1992 |
7.8 7.8 |
|
3 3 |
1993 1993 |
8.3 8.3 |
|
4 4 |
1994 1994 |
7.4 7.4 |
|
5 5 |
1995 1995 |
7.1 7.1 |
|
6 6 |
1996 1996 |
9.2 9.2 |
|
7 7 |
1997 1997 |
11.5 11.5 |
Plot the graph from the above data taking shortage percentage on the Y-axis and the year on the X-axis:
For example, for the year
1991
1991
we mark the point
7.9
7.9
on the Y-axis.
Similarly, plotting the other points we get,
Frequently Asked Questions
The NCERT solution for Class 8 chapter 5 : Coal and Petroleum is important as it provides a structured approach to learning, ensuring that students develop a strong understanding of foundational concepts early in their academic journey. By mastering these basics, students can build confidence and readiness for tackling more difficult concepts in their further education.
Yes, the NCERT solution for Class 8 Chapter 5 : Materials Metals and Non-Metals is quite useful for students in preparing for their exams. The solutions are simple, clear, and concise allowing students to understand them better. They can solve the practice questions and exercises that allow them to get exam-ready in no time.
You can get all the NCERT solutions for Class 8 Science Chapter 5 from the official website of the Orchids International School. These solutions are tailored by subject matter experts and are very easy to understand.
Yes, students must practice all the questions provided in the NCERT solution for Class 8 Science Chapter 5 : Coal and Petroleum as it will help them gain a comprehensive understanding of the concept, identify their weak areas, and strengthen their preparation.
Students can utilize the NCERT solution for Class 8 Science Chapter 5 effectively by practicing the solutions regularly. Solve the exercises and practice questions given in the solution.