

NCERT Solutions For Class 4 Maths Chapter 14 - Smart Charts
Smart Charts deals with the concept of data handling. This chapter have exercises on representing and drawing conclusion from data. Representing data using bar graphs and circle graphs. The solutions for Math-Magic Chapter-14 have been created and verified by our experienced subject matter experts, according to the CBSE syllabus and guidelines of NCERT. For practice, our subject matter experts have created very interactive, activity-based, and Image-based worksheets on these topics to enhance learning.
Download PDF For NCERT Solutions for Maths Smart Charts
The NCERT Solutions For Class 4 Maths Chapter 14 - Smart Charts are tailored to help the students master the concepts that are key to success in their classrooms. The solutions given in the PDF are developed by experts and correlate with the CBSE syllabus of 2023-2024. These solutions provide thorough explanations with a step-by-step approach to solving problems. Students can easily get a hold of the subject and learn the basics with a deeper understanding. Additionally, they can practice better, be confident, and perform well in their examinations with the support of this PDF.
Download PDF
Access Answers to NCERT Solutions For Class 4 Maths Chapter 14 - Smart Charts
Students can access the NCERT Solutions For Class 4 Maths Chapter 14 - Smart Charts. Curated by experts according to the CBSE syllabus for 2023–2024, these step-by-step solutions make Maths much easier to understand and learn for the students. These solutions can be used in practice by students to attain skills in solving problems, reinforce important learning objectives, and be well-prepared for tests.
Smart Charts
(1) Ask people in your family to name one programme they like and one programme they dislike. Make a table.

Ask each of your family members to name one TV programme that they like and one programme that they dislike and note them down in the table. The answer may vary from student to student based on their family and their choices. A sample answer is:

The kind of programme most family members dislike ________.
The answer will vary based on the previous table. Observe the data in the table carefully and find out the programme that is most disliked by majority of the family members.
The table shows that most of the family members dislike serials.

2) Find out from 20 friends the programmes they like and dislike, and write down the information in the table.

Ask 20 of your friends about the programmes they like and dislike and keep a count of the number of friends that like and dislike the programmes. Enter the data in the table. The answer may vary based on your friend’s choice.
A sample answer is:

Find out from your friends the time they spend in a week.
Ask your friends to keep a record of the time they spend in front of the TV or radio in a week and fill in the table accordingly. The answer will vary based on the information collected by your friends.
A sample answer is:

Note the time you spend in front of a TV or radio every day. Do this for one week. The time spent in a week is _________ hours.
Observe the time you spend watching TV or listening to the radio and keep a record of it for a week. The answer may vary from student to student.
A sample answer is:
Suppose you spend 1 hour daily watching TV, then time spent in a week is 7 hours.
So in a month you spend about 30 × ___ = _____ hours.
The answer will vary based on the previous answer. There are 30 days in a month. Multiply the time spend in a day by 30 to get the total time spent watching TV or listening to the radio in a month.
A sample answer is:
The time spent in a day is 1 hour.
Therefore, time spent in a month is:
30 × 1 = 30 hours.
From your table Watching TV/listening to the radio...
________ children spend more than 6 hours in a week.
________ children spend no time at all.
Most children spend ________ hours in a week.
________ children spend more than 3 hours.
Observe the data entered in the table to answer this question. The answer will vary based on the previous table.
A sample answer is:
8 children spend more than 6 hours in a week.
5 children spend no time at all.
Most children spend 5 hours in a week.
The table shows that 7 children spend 4 hours in a week, 9 children spend 5 hours in a week, 5 children spend 6 hours in a week, and 8 children spend more than six hours in week.
Add 7, 9, 5, and 8 to get the total number of children that spend more than 3 hours in a week.
7 + 9 + 5 + 8 = 29
Therefore, 29 children spend more than three hours.
The kind of programme most family members like ____.
The answer will vary based on the previous table. Observe the data in the table carefully and find out the programme that is most liked by majority of the family members.
A sample answer is:
The table shows that most of the family members like News.

Read the poem carefully and answer these questions:
a) Which word comes most often in the poem?
It can be observed that the word “I” has been used most often in the poem.
In the entire poem the word “I” is used 4 times.
b) Which letter has been used most?
It can observed that the letter “e” has been most often in the poem. In the entire poem the letter “e” is used 20 times.
Find out:
c) Which letter comes the least?
It can be observed that the letters “b” and “v” are least used in the poem. The letters “b” and “v” are used only once in the entire poem.
Take a paragraph you like from your language textbook. Read carefully and find out:
a) Which word comes most often?
How many times? ________
Answers may vary based on the paragraph selected. Choose any paragraph from your language textbook and read it carefully. Observe the words in the paragraph that have been repeated the maximum number of times. Count the number of times it is repeated to answer the question.
b) Which word comes least often? ________________
The answers will vary.
Answers may vary based on the paragraph selected. Observe the words in the paragraph that have been repeated the minimum number of times to answer the question.
c) The letter used most often is ________________
Answers may vary based on the paragraph selected. Observe each letter that is used in the paragraph and count the number of times it is used. Then find out the letter that has been used the most.
d) The letter used least often is ________________
Answers may vary based on the paragraph selected. Observe each letter that is used in the paragraph and count the number of times it is used. Then find out the letter that has been used the least.
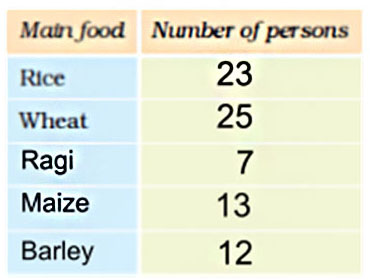
Compared to children who eat rice, those who eat wheat are more/less/equal.
Answers will vary based on the table in the previous answer. Observe the information in the table and see the number of children who eat rice and wheat. Check if the number of children eating rice is more/less/equal to the number of children eating wheat. A sample answer is:
The table shows that 23 children eat food made from rice and 25 children eat food made from wheat. Therefore, the children who eat rice are less in comparison to the children who eat wheat.
b) Which are more—children making the sets or those acting?
The number of children acting is equal to 9. There are 2 green triangles for making the sets. Multiply 3 by 2 to get the number of children making the sets.
2 × 3 = 6
Therefore, there are 6 children making the sets in the drama. Hence, the number of children acting is more than the number of children making the sets.
c) What is being done by most of the children?
It is observed from the table chart that the maximum number of green triangles are in playing the music. Therefore, most of the children play the music in the drama.
d) How many children are collecting dresses?
Each green triangle represents 3 children. From the table chart, it can be observed that there are 3 green triangles for collecting dresses. Multiply 2 by 3 to get the number of children collecting dresses.
2 × 3 = 6
Therefore, 6 children are collecting dresses in the drama.
Use a scale and find out from your chart:
The length of the longest strip is _________ cm. So ____________
has the biggest head.
Answers may vary based on the chart in the previous answer. Observe the length of each strip and check which is the longest one. Take a ruler and measure the length of the longest strip and also check who has the biggest head.
The smallest strip is ___________ cm long. It belongs to __________.
Answers may vary based on the chart in the previous answer. Observe the length of each strip and check which is the smallest one. Take a ruler and measure the length of the smallest strip and also check who has the smallest head.
a) How many children are acting in the drama?
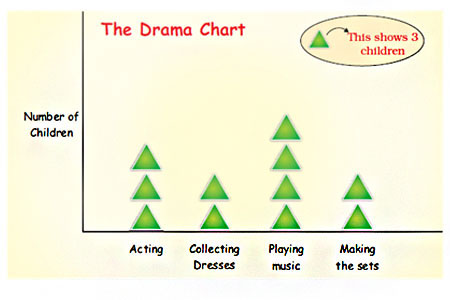
Each green triangle represents 3 children. From the table chart, it can be observed that there are 3 green triangles for acting.
Multiply 3 by 3 to get the number of children acting in the drama.
3 × 3 = 9
Therefore, 9 children are acting in the drama.
The Garden Club has ______ members.
The Chapati Chart shows that one-fourth of the students are the members of the Garden Club.
The total number of students is 200. Divide 200 by 4 to get the number of students who are members of the Garden Club.
200 ÷ 4 = 50
Hence, the Garden Club has 50 members.
There are _____ members in the Drawing Club.
The Chapati Chart shows that one-fourth of the students are the members of the Drawing Club.
The total number of students is 200. Divide 200 by 4 to get the number of students who are members of the Drawing Club.
200 ÷ 4 =50
Hence, there are 50 members in the Drawing Club.
Who likes to get wet in the rain? A child made this Chapati Chart after asking his friends.
See the Chapati Chart and tell:
1) How many children like to get wet in the rain?
a) half
b) one-fourth
c) three-fourth

Observe the Chapati Chart. If you divide the circle into four equal parts, three parts represent the children who like to get wet in the rain. Therefore, three-fourth of the children like to get wet in the rain. Hence, option c) is the correct answer.
2) How many children do not like to get wet in the rain?
a) half
b) one-fourth
c) three-fourth
Observe the Chapati Chart. If you divide the circle into four equal parts, one part represents the children who do not like to get wet in the rain.
Therefore, one-fourth of the children do not like to get wet in the rain.
Hence, option b) is the correct answer.
If the number of children in the class is 28, then tell the number of children
Who like to get wet in the rain?
Step 1: The total number of children is 28. Three-fourth of the children like to get wet in the rain. Divide 28 by 4 to get one-fourth of the children.
28 ÷ 4 = 7
Step 2: Multiply 7 by 3 to get three-fourth of the total children.
7 × 3 = 21
Therefore, 21 children like to get wet in the rain.
Who do not like to get wet in the rain __________
Total number of children is 28.
Number of children who like to get wet in the rain is 21.
Subtract 21 from 28 to get the number of children who do not like to get wet in the rain.
28 – 21 = 7
Therefore, 7 children do not like to get wet in the rain.
Some children were asked which of these they liked most—Tea, Coffee or Milk.
Total Number of children ______.

Add 20, 10, and 10 to get the total number of children.
20 + 10 + 10 = 40
Therefore, there are 40 children in total.
Find out from the table:
Children who like milk are 1/2 or 1/4 of the total children.
Total number of children is 40.
Number of children who like milk is 20 which is half of the total students. Therefore, children who like milk are 1/2 of the total children.
Children who like coffee are 1/2 or 1/4 of the total children.
Total number of children is 40.
Number of children who like milk is 10 which is equal to one-quarter of the total student.
Therefore, children who like coffee are 1/4 of the total children.
Show the liking for Tea, Coffee or Milk in a Chapati Chart.
From the table: Half of the children like milk, one- quarter of the children like coffee, and one-quarter of the children like tea.
Draw a circle and shade half of a circle with a colour to represent the children who like milk, shade one-quarter of the circle with another colour to represent the children who like coffee, and shade one- quarter of the circle with a different colour to represent the children who like tea.

How many children like sports programmes?
Answers will vary based on the previous table. Observe the last row and the second column, that is, “Number of children liking it” to check the number of children who like sports programmes.
A sample answer is:
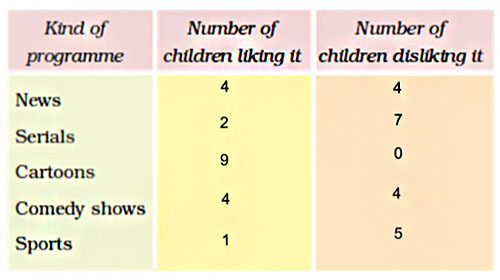
The table shows that 1 child likes sports.
Which kind of programme is liked by most children?
The answer will vary based on the previous table. Observe the second column, i.e., “Number of children liking it” and look for the highest number. The programme that corresponds to the highest number will be the correct answer.
A sample answer is:
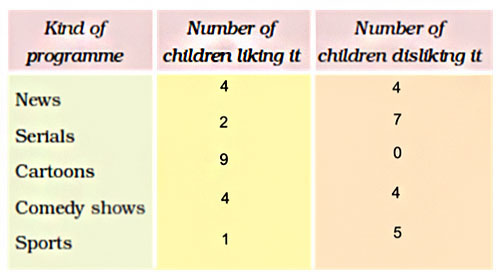
The table shows that most of the children like cartoons.
Which kind of programme is disliked by the least number of children?
The answer will vary based on the previous table. Observe the third column, that is “Number of children disliking it” and look for the lowest number. The programme that corresponds to the lowest number will be the correct answer.
A sample answer is:
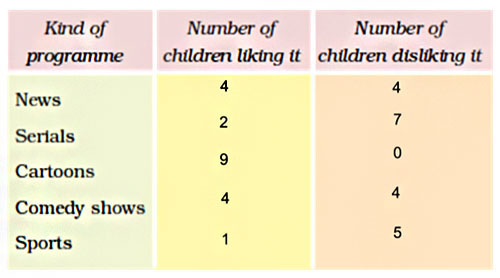
The table shows that most of the children dislike serials.
Look at the table and tell:
Most children eat food made from _____________.
Answers may vary based on the table in the previous answer. Observe the information in the table and look at the largest number in the second column. The main food that corresponds to the largest number is the correct answer. A sample answer is:
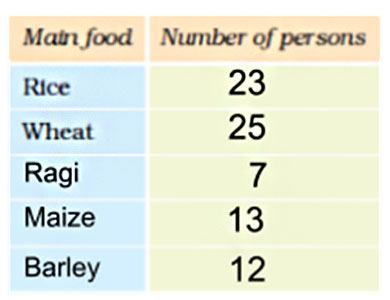
The table shows that most of the children eat food made from rice.
Compared to those who eat wheat, children eating ragi are more/less.
Answers will vary based on the table in the previous answer. Observe the information in the table and see the number of children who eat wheat and ragi. Check if the number of children eating wheat is more or less than the number of children eating ragi. A sample answer is:
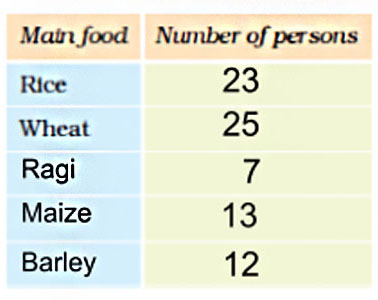
The table shows that 25 children eat food made from wheat and 7 children eat food made from ragi. Therefore, the children who eat wheat are more in comparison to the children who eat ragi.
Cut long paper strips from waste paper. Give one strip to each of your friends. Now put the paper strip around your head and tear off the extra strip. On a big sheet, paste these paper strips along a line. Some children had pasted their strips and made a chart like this.
Your chart should also look like this.
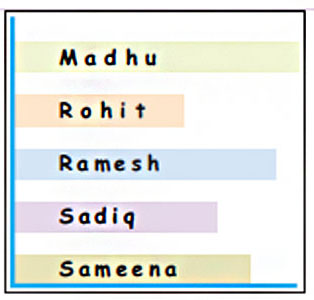
Take a sheet of waste paper and cut it into a few strips. Give one strip to each friend. Ask your friend to put the strip around their head and cut off the extra bits. Place all the strips on a sheet to make a chart. The answer may vary based on the friend’s head.
The Chapati Chart shows the number of children in different clubs.
If there are 200 students in the school, look at the above Chapati Chart and tell the number of members in each club:
The Games Club has ______ members.
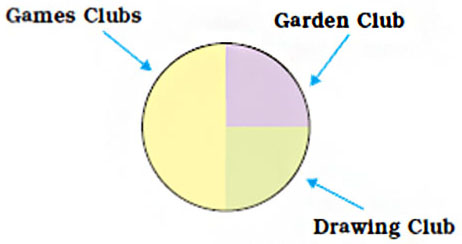
The above Chapati Chart shows that half of the students are the members of the Games Club.
The total number of students is 200. Divide 200 by 2 to get the number of students who are members of Games Club.
200 ÷ 2 = 100
Hence, the Games Club has 100 members.
Is there any kind of programme not liked by anyone? Yes/No.
If yes, which one?
Answers will vary based on the previous table. Observe the second column, that is, “Number of children liking it” and check if any row has 0. If it has 0 then there are programmes that are not liked by anyone or else there will be no programme that is not liked by anyone.
A sample answer is:
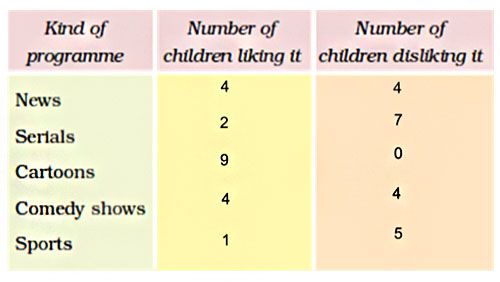
The table shows that there is no such programme that is not liked by any children.
Find out from your classmates and fill the table:
Ask your friends about their main food. Count the number of friends that eat the same kind of food and enter it in the table. Answers may vary based on the information collected from your friends.
A sample answer is:
Frequently Asked Questions
The NCERT solution for Class 4 Chapter 14: Smart Charts is important as it provides a structured approach to learning, ensuring that students develop a strong understanding of foundational concepts early in their academic journey. By mastering these basics, students can build confidence and readiness for tackling more difficult concepts in their further education.
Yes, the NCERT solution for Class 4 Chapter 14: Smart Charts is quite useful for students in preparing for their exams. The solutions are simple, clear, and concise allowing students to understand them better. They can solve the practice questions and exercises that allow them to get exam ready in no time.
You can get all the NCERT solutions for Class 4 Maths Chapter 14 from the official website of the Orchids International School. These solutions are tailored by subject matter experts and are very easy to understand.
Yes, students must practice all the questions provided in the NCERT solution for Class 4 Maths Chapter 14: Smart Charts as it will help them gain a comprehensive understanding of the concept, identify their weak areas, and strengthen their preparation.
Students can utilize the NCERT solution for Class 4 Maths Chapter 14 effectively by practicing the solutions regularly. Solve the exercises and practice questions given in the solution.