
Bar Graph Questions
Solving bar graph questions helps us to visualise and interpret data easily with rectangular bars. These graphs are commonly used in mathematics, competitive exams and real-world data analysis such as to represent business trends, population statistics, weather reports, etc. Bar graphs are an important way to represent statistical data. By going through this article you will learn about what are different types of bar graph, their properties and representation.
Table Of Contents
- How to Solve Bar Graph Questions?
- Different Types of Bar Graph
- Bar Graph Questions With Solutions
- Bar Graph Examples for Practice
- Conclusion
- Frequently Asked Questions on Bar Graphs Questions
How to Solve Bar Graph Questions?
Solving bar graph questions involves analysing or drawing bar charts. So, before solving bar graph questions we need to learn a little bit about bar graph and its types. In a bar graph each bar represents a category, and its value is shown by the bar's height or length. The bars are evenly spaced and have equal width. They are commonly used in data handling, statistics, and practical applications, making it easy to compare several sets of data.

Different Types of Bar Graph
There are various types of bar graphs used based on the data and comparison needs.
1. Vertical Bar Graph
In vertical bar graphs, the bars stand upright, and the height of each bar shows the data value.
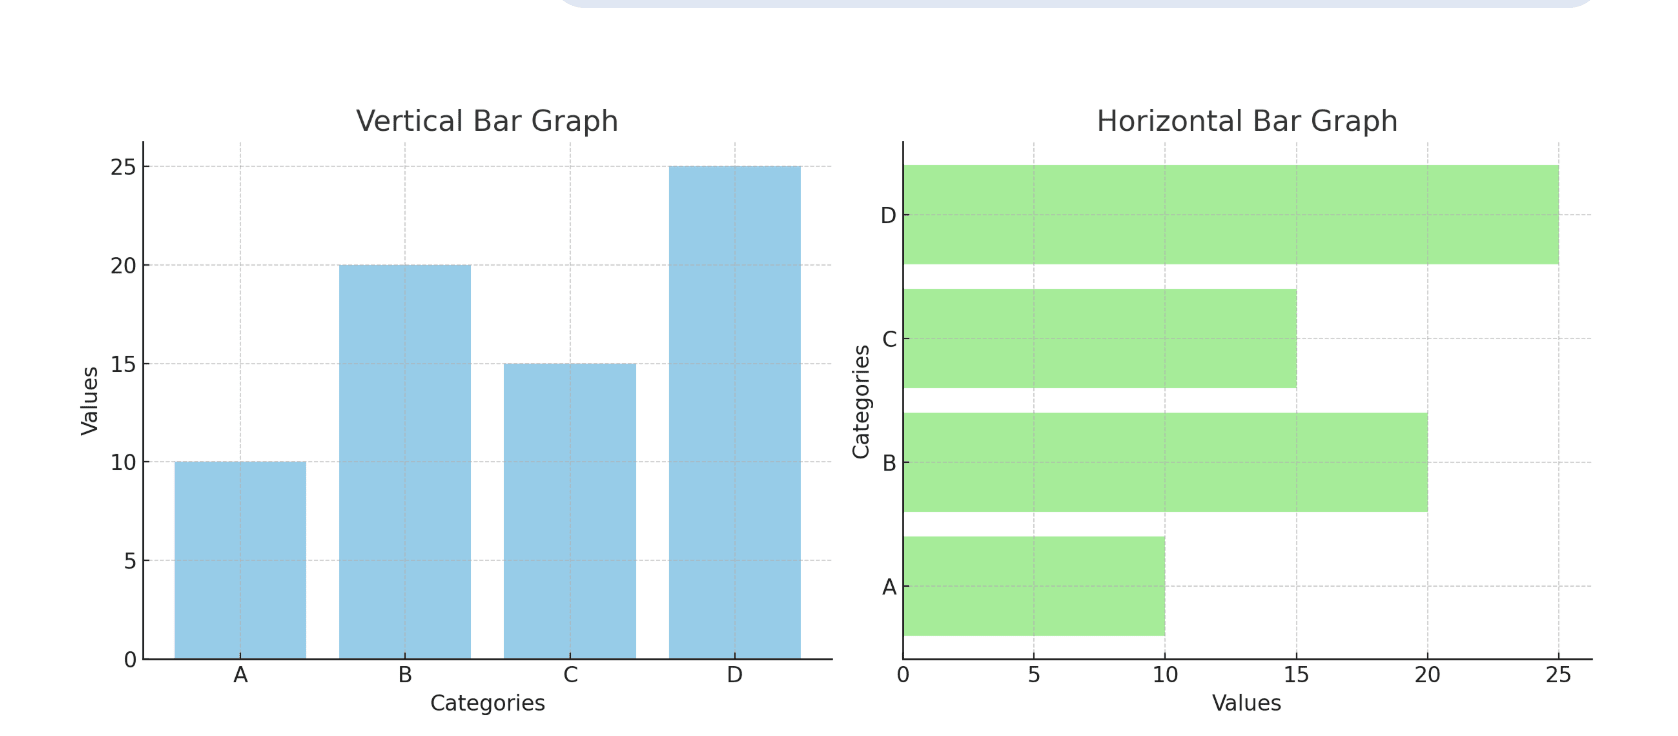
2. Horizontal Bar Graph
In horizontal bar graphs, the bars stretch sideways. This format is best when category names are long.
3. Grouped Bar Graph
A grouped bar graph shows bars for multiple categories grouped for comparison.
4. Stacked Bar Graph
A stacked bar graph displays subcategories stacked on top of each other to show totals.
Know more about related topics:
Bar Graph Questions With Solutions
Question 1: A survey asked kids their favourite fruits. Results are shown in the vertical bar grpah. Which fruit was the least favourite among kids?

Solution:
1. Understand graph orientation: Bars extend horizontally, left to right.
2. Compare bar lengths: The shortest bar indicates the least preferred fruit.
3. Review values:
| Apple | 20 |
| Banana | 35 |
| Strawberry | 22 |
| Orange | 15 (shortest bar) |
Answer: Orange is the least favourite fruit with 15 votes.
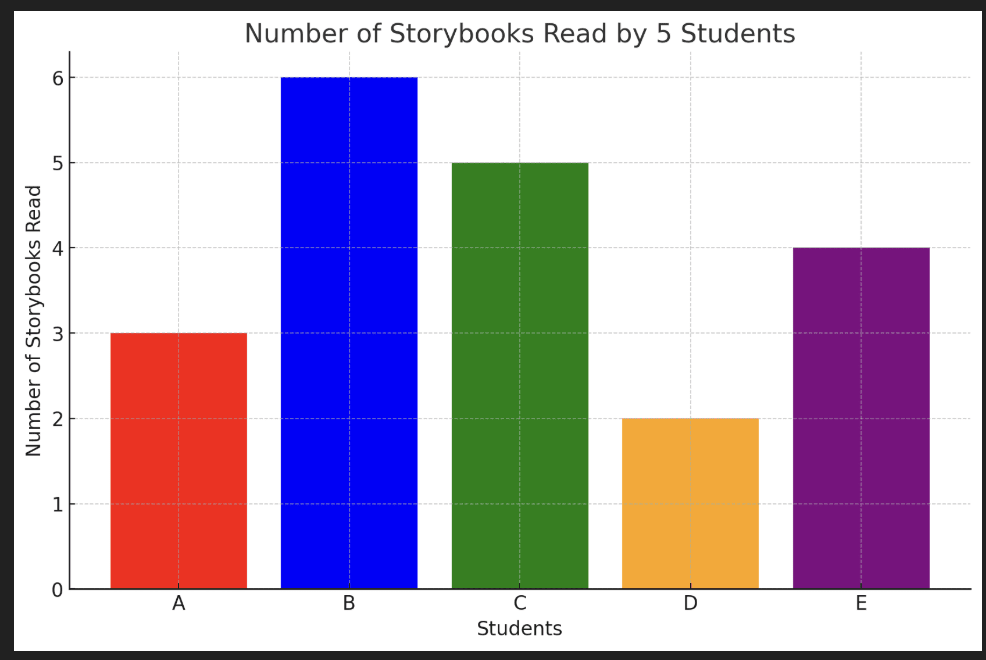
Question 2: Data for number of storybooks read by 5 students is given in the bar graph below. Who reads the most books?
A - 3 books, B - 6 books, C - 5 books, D - 2 books, E - 4 books
Solution:
We are dealing with a vertical bar graph where each student’s data is represented by a bar with height equal to books read.
Observe the tallest vertical bar and compare values:
| Students | Number of storybooks read |
| A | 3 books |
| B | 6 books(Tallest bar) |
| C | 5 books |
| D | 2 books |
| E | 4 books |
B has the highest value representing 6 books. So, student B read the most books.
Answer: Student B.
Question 3: The data for students' favourite school subjects is given below in the graph. Which subject is least popular?
Math - 25 votes, Science - 30 votes, History - 20 votes, English - 15 votes

Solution: Check the shortest horizontal bar.
English has the shortest bar (15 votes).
Answer: English is the least preferred subject.
Question 4: On a News Channel Puja Saw, the Average Rainfall in Malda Is 1207 mm, Bankura Is 1227 mm, Asansol Is 1140 mm, and Digha Is 1192 mm. Represent the Rainfall in a Vertical Bar Graph.
Solution:
According to the news channel:
- In Malda, the average rainfall is 1207 mm
- In Bankura, the average rainfall is 1227 mm
- In Asansol, the average rainfall is 1170 mm and
- In Digha, the average rainfall is 1192 mm.
The bar graph is given below according to the given data:

Question 5: Data shows the marks scored by two students (Anya & Rahul) in 3 subjects. Who scored more in total?
| Subject | Anya's Marks | Rahul's Masks |
| Maths | 80 | 70 |
| Science | 75 | 85 |
| English | 90 | 95 |
Solution:
Calculate the total for each student:
Anya = 80 + 75 + 90 = 245
Rahul = 70 + 85 + 95 = 250
Compare totals: Rahul's total is higher.
Answer: Rahul scored more marks overall (250 vs 245).
Question 6: The sales of two products (A and B) over three months is given. In which month were total sales (A + B) the highest?
|
Month |
Product A Sales |
Product B Sales |
|
January |
20 |
10 |
|
February |
25 |
15 |
|
March |
30 |
20 |
Step-by-Step Solution:
Stacked format: Product B's bar is stacked on top of Product A's.
Calculate totals:
January = 20 + 10 = 30
February = 25 + 15 = 40
March = 30 + 20 = 50
Compare total sales: March has the tallest stacked bar.
Answer: March had the highest total sales (50 units).
Question 7:
Below Is the Bar Graph That Represents the Data for the Rainfall of the First Five Months of a Place.
Observe the Graph Properly and Answer the Following Question:
a) In Which Month Was the Highest Rainfall Recorded?
b) What Is the Average Rainfall for the First Five Months?
c) If the Total Rainfall Falls on the Area of 16 Square Cm, Then Calculate the Volume of the Rain.
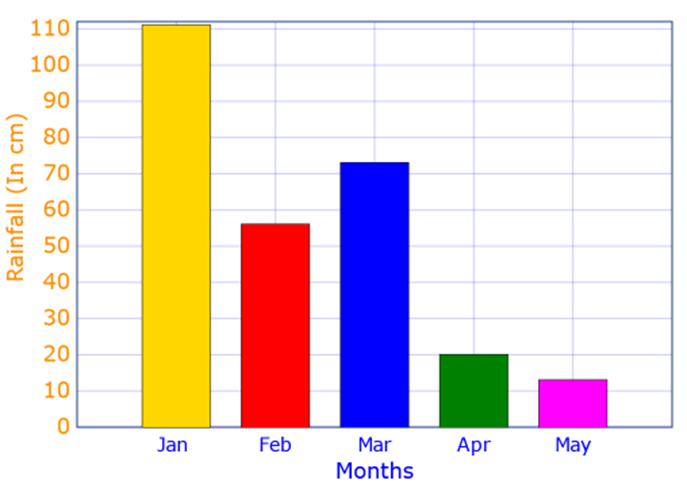
a) According to the graph, the highest bar is in January. Therefore, the highest rainfall is recorded in January and is equal to 111 cm.
b) The graph shows that:
In January, the rainfall depth was 111 cm.
In February, the rainfall depth was 56 cm.
In March, the rainfall depth was 73 cm.
In April, the rainfall depth was 20 cm.
In May, the rainfall depth was 13 cm.
Add all the rainfall depths to get the total rainfall.
Total rainfall = 111 + 56 + 73 + 20 + 13 cm
= 273 cm
The total rainfall = 273 cm
Number of months = 5
Average rainfall of the five months= 273/5=54.6
c) The formula to calculate the volume of rainwater is:
Volume = Area × Total rainfall
= 16 × 273
= 4368
Therefore, 4368 cubic cm of rainwater was collected.
Bar Graph Examples for Practice
-
Favourite colour of ladies: Red - 10, Green - 7, Orange - 5
-
Test marks in subjects: English - 70, Math - 90, Science - 85
-
Number of goals scored: Team A - 5, Team B - 3, Team C - 7
-
Rainfall in mm: Jan - 50, Feb - 60, Mar - 40
-
Number of pets owned by students: Cat - 6, Dog - 10, Fish - 4
How to Draw a Bar Graph
Steps:
-
Collect and organise data.
-
Draw the x-axis (categories) and y-axis (values).
-
Choose an appropriate scale.
-
Plot bars with equal width and correct height.
-
Label the graph and give it a title.
Properties of Bar Graph
-
Equal-width bars.
-
Uniform spacing between bars.
-
Bar height = data value.
-
Each bar is independent.
-
Labels and titles are necessary.
|
Property |
Bar Graph |
Line Graph |
|
Representation Style |
Bars |
Connected points |
|
Data Type |
Categorical |
Continuous |
|
Suitable for Beginners |
Yes |
Partially |
|
Visual Impact |
High |
Moderate |
Conclusion
Bar graph questions enhance visual learning and are a crucial skill in both academic and real-world problem-solving. Understanding how to draw a bar graph, its properties, and practising with bar graph questions and solutions builds a solid mathematical foundation. To strengthen your learning, regularly solve examples for practice and explore the different types of bar graphs with real data!
Frequently Asked Questions on Bar Graphs Questions
1. What are bar graph questions?
Answer: Bar graph questions involve interpreting or analysing data presented in the form of rectangular bars.
2. How to make a bar graph question?
Answer: Create a question by giving categorical data and asking the student to represent it as a bar graph.
3. How to explain a bar graph?
Answer: Explain a bar graph by discussing the categories, the height or length of bars, and the comparison shown.
4. How to draw a bar graph?
Answer: To draw a bar graph, label the axes, choose a scale, and draw bars representing each data value accurately.
Solve bar graph questions easily with step-by-step help from Orchids The International School.
Numbers make sense when they're taught right. To see how Orchids The International School turns Maths from intimidating to intuitive, reach out to our admissions team.
Related Links
Admissions Open for 2026-27
What type of concept pages would you prefer?
CBSE Schools In Popular Cities
- CBSE Schools in Bangalore
- CBSE Schools in Mumbai
- CBSE Schools in Pune
- CBSE Schools in Hyderabad
- CBSE Schools in Chennai
- CBSE Schools in Gurgaon
- CBSE Schools in Kolkata
- CBSE Schools in Indore
- CBSE Schools in Sonipat
- CBSE Schools in Delhi
- CBSE Schools in Rohtak
- CBSE Schools in Bhopal
- CBSE Schools in Aurangabad
- CBSE Schools in Jabalpur
- CBSE Schools in Jaipur
- CBSE Schools in Jodhpur
- CBSE Schools in Nagpur
- CBSE Schools in Ahmednagar
- CBSE School In Tumkur


Orchids The International School is one of India's leading chains of CBSE and ICSE schools, with 110+ schools across the country.