
How to Create a Pie Chart
A pie chart is a popular way to show data visually. Whether you're looking at business reports, student grades, or survey responses, pie charts make it easy to see how parts relate to the whole. Each slice of the pie represents a portion of the total, which is really helpful for understanding data quickly. on this page, we’ll go over what a pie chart is, how to create a pie chart and use it along with examples. Let’s get started!
Table of Contents
- What is a Pie Chart?
- Pie Chart Definition
- How to Create a Pie Chart
- Pie Chart Formula
- How to Read a Pie Chart
- Pie Chart Examples
- Conclusion
- Frequently Asked Questions on Pie Chart

What is a Pie Chart?
The term "pie chart" comes from its similarity to a sliced pie. It is a chart that helps us quickly illustrate how each category contributes to the whole. It is commonly used in statistics, business, education, and media to present percentages and comparisons in a straightforward visual format. For example, we can show the student’s activities like playing, studying, sleeping, etc throughout the day using a pie chart diagram.
Representation of student’s activities through a pie chart:
Know more about related topics:
Definition of Pie Chart
A pie chart, also called a circle chart, is a circular graph divided into slices that show proportions. Each slice represents a portion of the total, and together, all slices add up to 100% of the data. Larger slices indicate larger values, while smaller slices represent smaller values. To determine the size of each slice in the pie chart we need to know the angle that it forms at the center of the pie chart. Here is the formula used to calculate the angle of each slice in pie chart:
Formula of Pie Chart:
To calculate the angle of each slice in a pie chart:
Angle of Slice = (Category Value ÷ Total Value) × 360°
This formula turns numerical data into circular segments, making it easy to see proportions.
How to Create a Pie Chart
Here’s is a step-by-step process of creating a pie chart:
Step 1: First, list each data category and their respective values.
For example: Let's create a pie chart for a student daily activities like studies, sleeping, playing, etc. for a day:
Time spent for studying = 4 hours
Time for sleeping = 8 hours
Time for playing = 6 hours
Others = 6 hours
Step 2: Add up all the values:
Now, we need to check the total time = 4 + 8 + 6 + 6 = 24 hours
Step 3: Calculate the percentage of each category:
Study = (4 ÷ 24) × 100 = 16.7%
Sleep = (8 ÷ 24) × 100 = 33.3%
Play = (6 ÷ 24) × 100 = 25%
Others = (6 ÷ 24) × 100 = 25%
Step 4: Turn each percentage into an angle using given formula.
Formula: (Percentage × 360°) ÷ 100
Study = (16.7 × 360) ÷ 100 ≈ 60°
Sleep = (33.3 × 360) ÷ 100 ≈ 120°
Play = (25 × 360) ÷ 100 = 90°
Others = (25 × 360) ÷ 100 = 90°
Step 5: Draw a circle and divide it into slices.
Use a protractor to mark 60°, 120°, 90°, and 90°.
Each slice represents one category. 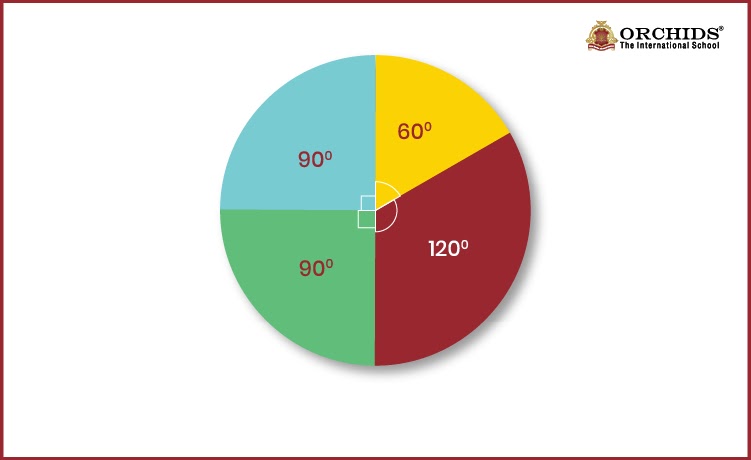
Step 6: Label each slice.
Write "Study - 16.7%", "Sleep - 33.3%", "Play - 25%", and "Others - 25%".
Final Result: A pie chart that clearly shows how a student spends their 24 hours in a day.
Pie Chart Percentage Formula
Formulas:
-
Percentage = (Individual Value ÷ Total Value) × 100
-
Angle = (Individual Value ÷ Total Value) × 360°
Example: A class has 40 students: 15 like Math, 10 like Science, 15 like English.
Step 1: Total Students
Total = 40
Step 2: Percentage
-
Math: (15 ÷ 40) × 100 = 37.5%
-
Science: (10 ÷ 40) × 100 = 25%
-
English: (15 ÷ 40) × 100 = 37.5%
Step 3: Angle
-
Math: (15 ÷ 40) × 360° = 135°
-
Science: (10 ÷ 40) × 360° = 90°
-
English: (15 ÷ 40) × 360° = 135°
Answer:
-
Math: 37.5%, 135°
-
Science: 25%, 90°
-
English: 37.5%, 135°
How to Read a Pie Chart
To interpret a pie chart, follow these steps:
-
Check the total: The whole pie equals 100%.
-
Read the labels: Each slice has a label showing its name, percentage, or value.
-
Compare sizes: Bigger slices represent larger amounts.
-
Look for legends: Colours or patterns help match slices with data.
Being able to read a pie chart is important in exams, reports, and presentations.
Pie Chart Examples
Example 1: Creating a Pie Chart
Question: A student spends 4 hours studying, 2 hours on sports, and 6 hours sleeping. Draw a pie chart.
Solution: Total time = 12 hours.
Study angle = (4/12) × 360 = 120°
Sports angle = (2/12) × 360 = 60°
Sleep angle = (6/12) × 360 = 180°.
Draw the pie and label each slice.
Example 2: Percentage Conversion
Question: If the Food slice in a pie chart is 90°, what percentage is that?
Solution: (90/360) × 100 = 25%.
So, Food is 25% of the total.
Example 3: Reading a Pie Chart
Question: In a survey, 50% chose chocolate, 30% chose vanilla, and 20% chose strawberry. Which flavour is the most popular?
Solution: Chocolate (50%) has the largest slice.
Example 4: Angle for Given Value
Question: If 40 out of 100 people like tea, what angle does that represent?
Solution: (40/100) × 360 = 144°.
So, tea takes up 144°.
Example 5: Class Performance Pie Chart
Question: A class has 25 A grades, 15 B grades, and 10 C grades. Draw pie chart sectors.
Solution: = 50.
A: (25/50) × 360 = 180°.
B: (15/50) × 360 = 108°.
C: (10/50) × 360 = 72°.
Conclusion
Pie charts are a straightforward way to visualise data parts. This guide gives you all the info on pie charts, from their definitions to how to create and read them. Whether you're a student, teacher, or analyst, knowing how to work with pie charts can turn data into useful insights. Now that you’ve got the hang of it, start making your pie charts and let the data tell its story!
Learn how to represent data visually and effectively with pie charts at Orchids The International School!
Numbers make sense when they're taught right. To see how Orchids The International School turns Maths from intimidating to intuitive, reach out to our admissions team.
Frequently Asked Questions on Pie Chart
1. What is the entire clarification of a pie chart?
A pie chart is a round graph divided into slices to symbolise the relative proportions of different classes within an entire.
2. What are the rules for pie charts?
The main rule for pie charts is that all slices must total 100% or 360° of the circle.
3. What is known as a pie graph?
A pie graph is every other call for a type of chart, used to visually represent records elements of an entire.
4. What are the 4 varieties of pie charts?
Standard pie chart, 3D pie chart, exploded pie chart, and doughnut chart.
Related Links
Admissions Open for 2026-27
What type of concept pages would you prefer?
CBSE Schools In Popular Cities
- CBSE Schools in Bangalore
- CBSE Schools in Mumbai
- CBSE Schools in Pune
- CBSE Schools in Hyderabad
- CBSE Schools in Chennai
- CBSE Schools in Gurgaon
- CBSE Schools in Kolkata
- CBSE Schools in Indore
- CBSE Schools in Sonipat
- CBSE Schools in Delhi
- CBSE Schools in Rohtak
- CBSE Schools in Bhopal
- CBSE Schools in Aurangabad
- CBSE Schools in Jabalpur
- CBSE Schools in Jaipur
- CBSE Schools in Jodhpur
- CBSE Schools in Nagpur
- CBSE Schools in Ahmednagar
- CBSE School In Tumkur


Orchids The International School is one of India's leading chains of CBSE and ICSE schools, with 110+ schools across the country.