

Vertical Bar Graph
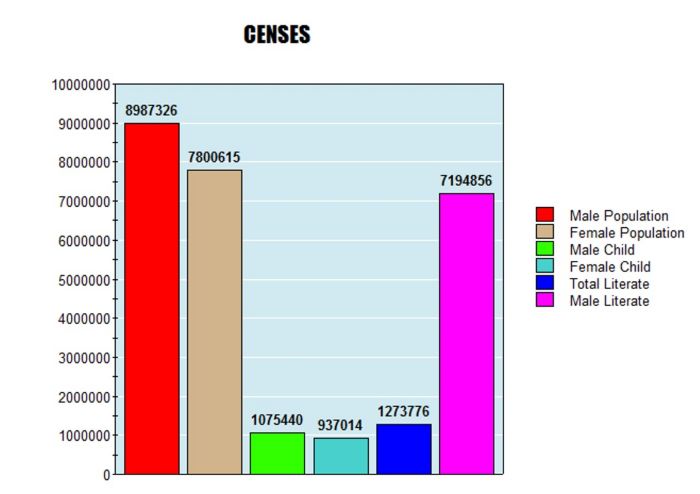
1) Draw a Bar Graph to Represent the Given Data for the Year 2011.
Take 1 Unit = 10,00,000

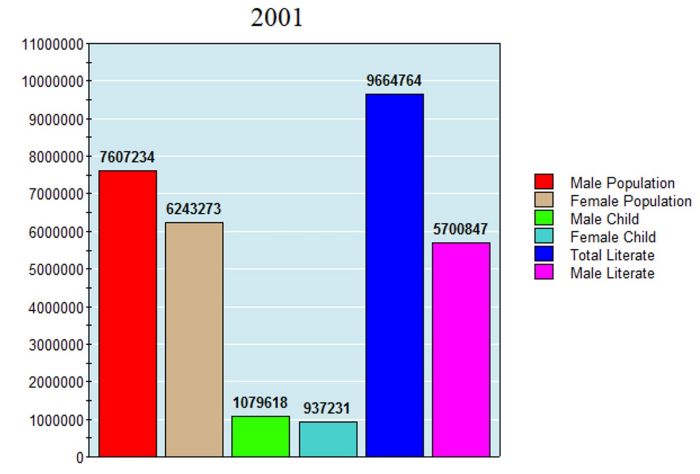
2) Draw a Bar Graph to Represent the Given Data for the Year 2001.
Take 1 Unit = 10,00,000
Numbers make sense when they're taught right. To see how Orchids The International School turns Maths from intimidating to intuitive, reach out to our admissions team.
Related Links
Share


Admissions Open for 2026-27
Quick Poll
What type of concept pages would you prefer?
CBSE Schools In Popular Cities
- CBSE Schools in Bangalore
- CBSE Schools in Mumbai
- CBSE Schools in Pune
- CBSE Schools in Hyderabad
- CBSE Schools in Chennai
- CBSE Schools in Gurgaon
- CBSE Schools in Kolkata
- CBSE Schools in Indore
- CBSE Schools in Sonipat
- CBSE Schools in Delhi
- CBSE Schools in Rohtak
- CBSE Schools in Bhopal
- CBSE Schools in Aurangabad
- CBSE Schools in Jabalpur
- CBSE Schools in Jaipur
- CBSE Schools in Jodhpur
- CBSE Schools in Nagpur
- CBSE Schools in Ahmednagar
- CBSE School In Tumkur











Orchids The International School is one of India's leading chains of CBSE and ICSE schools, with 110+ schools across the country.