
Case Study on Maths Class 10 Chapter 13 ‘Statistics’ with Questions and Answers
This collection of case-study questions for Chapter 13: Statistics (Class 10) follows CBSE and NCERT guidelines and presents short, exam-style scenarios designed to strengthen data interpretation, statistical reasoning, and step-by-step problem solving. The set uses real-world contexts and classroom-style prompts to help students practice grouping raw data, constructing and interpreting frequency distributions, finding measures of central tendency for both ungrouped and grouped data, and applying the cumulative frequency method to locate medians and quartiles. Answers are provided with clear reasoning, diagram guidance, and concise steps to help learners develop procedural fluency and confidence for board examinations. The downloadable PDF includes additional practice sets for quick revision and classroom worksheets to improve speed and accuracy.
Solved Statistics Case Study Questions and Answers
CBSE's case-based questions usually give you a short passage describing a real situation, sometimes with a small figure, followed by 4 - 5 questions of increasing difficulty, a couple of MCQs to check basic understanding, a short-answer question that needs a calculation, and a longer question that asks you to interpret or justify your answer.

Key Formulas at a Glance
-
Mean: Direct Method
Mean (x̄) = Σfᵢxᵢ / Σfᵢ
where xᵢ = class mark (midpoint of class interval)
-
Mean: Step Deviation Method
Mean (x̄) = a + h × (Σfᵢuᵢ / Σfᵢ)
where a = assumed mean, h = class width, uᵢ = (xᵢ − a)/h
-
Median
Median = l + [(n/2 − cf) / f] × h
l = lower limit of median class, cf = cumulative frequency of class before median class, f = frequency of median class, h = class width
-
Mode
Mode = l + [(f₁ − f₀) / (2f₁ − f₀ − f₂)] × h
f₁ = frequency of modal class, f₀ = frequency of class before, f₂ = frequency of class after
-
Empirical Relationship
Mode = 3 Median − 2 Mean
OR: 3 Median = Mode + 2 Mean
Case Study 1: Monthly Savings of Families
Situation: A social welfare organisation surveyed 50 families in a residential colony of Bengaluru to study their monthly savings. The data collected is given in the table below. The organisation wants to find the average monthly savings to plan a financial literacy workshop.
(i) The class mark (mid-point) of the class 1500 - 2000 is:
(a) 1500
(b) 1750
(c) 2000
(d) 1600
(ii) The value of Σfᵢxᵢ for the entire distribution is ________.
(iii) Calculate the mean monthly savings of the families.
(iv) True or False:
If every families savings increase by ₹500, the mean will remain ₹1810.
(v) Which class interval has the highest frequency?
(a) 1000–1500
(b) 2000–2500
(c) 1500–2000
(d) 2500–3000
Solution:
(i) (b) 1750
Class mark = (Lower limit + Upper limit) ÷ 2 = (1500 + 2000) ÷ 2 = 1750
(ii) Answer: ₹90,500
Calculation:
6×750 + 10×1250 + 14×1750 + 12×2250 + 8×2750
= 4500 + 12500 + 24500 + 27000 + 22000
= ₹90,500
(iii) Answer: ₹1810
Mean = Σfᵢxᵢ / Σfᵢ
= 90500 / 50
= ₹1810
The mean monthly savings of the families is ₹1810.
(iv) FALSE
When a constant is added to every observation, the mean also increases by that same constant. So the new mean = ₹1810 + ₹500 = ₹2310.
(v) Answer: (c) 1500–2000
The frequency 14 is the highest, which belongs to the class interval 1500–2000. This is also the modal class for this distribution.
Case Study 2: Shoe Sales in a Store
Situation: A popular footwear store in Jaipur sold 100 pairs of sports shoes in a day. The sizes (in cm) of shoes sold are recorded below. The store manager wants to know the mode shoe size so she can stock inventory smartly.
(i) The modal class of the distribution is:
(a) 22–24
(b) 26–28
(c) 24–26
(d) 28–30
(ii) In the mode formula, the value of f₁ is ______, f₀ is _____, and f₂ is ______ .
(iii) Calculate the mode shoe size.
(iv) True or False:
Mode can only be used for grouped data, not for ungrouped data.
Solutions:
(i) Answer: (c) 24–26
The highest frequency is 32, which belongs to the class 24 - 26. This is the modal class.
(ii) f₁ = 32, f₀ = 15, f₂ = 28
f₁ = frequency of modal class (24–26) = 32
f₀ = frequency of class before modal class (22–24) = 15
f₂ = frequency of class after modal class (26–28) = 28
(iii) Modal class = 24–26
l = 24, f₁ = 32, f₀ = 15, f₂ = 28, h = 2
Mode = l + [(f₁ − f₀) / (2f₁ − f₀ − f₂)] × h
= 24 + [(32 − 15) / (64 − 15 − 28)] × 2
= 24 + [17 / 21] × 2
= 24 + 34/21
= 24 + 1.619...
≈ 25.62 cm
The mode shoe size is approximately 25.62 cm. The manager should stock sizes around 25–26 cm most heavily.
(iv) FALSE
For ungrouped data, mode is simply the value that appears most often. The formula Mode = l + [(f₁−f₀)/(2f₁−f₀−f₂)] × h applies only to grouped data (class intervals with frequencies).
Case Study 3: Hospital Patient Ages
Situation: A government hospital in Delhi recorded the ages of 100 patients who visited the OPD on a particular day. The data, in cumulative form, is given below. The hospital administrator wants to find the median age and also understand how to draw an ogive to represent the data visually.
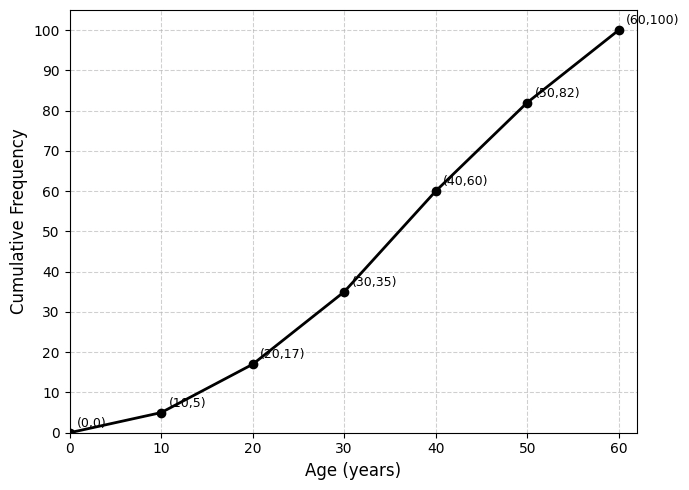
(i) For drawing a less than ogive, the points plotted are of the form:
(a) (Lower limit, cumulative frequency)
(b) (Upper limit, cumulative frequency)
(c) (Class mark, frequency)
(d) (Upper limit, frequency)
(ii) To find the median graphically from the less than ogive, we draw a horizontal line from _______ on the y-axis.
(iii) Calculate the median age of the patients.
(iv) True or False:
The less than ogive and more than ogive, when drawn on the same axea, always intersect at a point whose x- coordinate gives the median.
(v) The upper limit of the median class in this data is:
(a) 30
(b) 50
(c) 40
(d) 35
Solutions:
(i) Answer: (b) (Upper limit, cumulative frequency)
For a less than ogive, we plot (upper class limit, cumulative frequency). For example, the first point is (10, 5), meaning fewer than 10 patients are aged less than 10 years.
(ii) Answer: 50 (i.e., n/2 = 100/2 = 50)
We mark n/2 = 50 on the y-axis, draw a horizontal line to meet the ogive, then drop a perpendicular to the x-axis. The x-value at this point is the median.
(iii) n = 100, n/2 = 50
cf at 20 - 30 = 35 (less than 50)
cf at 30 - 40 = 60 (first to exceed 50) ⇒ Median class = 30 - 40
l = 30, cf = 35, f = 25, h = 10
Median = 30 + [(50 − 35) / 25] × 10
= 30 + [15/25] × 10
= 30 + 6
= 36 years
The median age of patients is 36 years.
(iv) TRUE
This is a direct fact. The x-coordinate of the intersection of the less than and more than ogives gives the median of the distribution. The y-coordinate of that intersection equals n/2.
(v) (c) 40
The median class is 30 - 40. Its upper limit is 40.
Download Free PDF - Case Study: Class 10 Chapter 13 - Statistics
Frequently Asked Questions of Chapter 13: Statistics Case Study for Class 10
1. What is the empirical relationship between mean, median and mode?
The empirical relationship is: Mode = 3 Median − 2 Mean, or equivalently, 3 Median = Mode + 2 Mean.
2. How do you find the median class in grouped data?
Median = l + [(n/2 − cf)/f] × h, where cf is the cumulative frequency of the class before the median class.
3. How is a less than ogive different from a more than ogive?
A less than ogive plots (upper class limit, cumulative frequency) and rises from left to right. A more than ogive plots (lower class limit, cumulative frequency) and falls from left to right.
4. Which method of finding mean should I use in a case study question?
For case study sub-questions where n is small and class marks are manageable, the Direct Method is fastest and clearest. For larger values, the Step Deviation Method saves calculation time. The question may specify which to use, if not, choose what you're most confident with.
Numbers make sense when they're taught right. To see how Orchids The International School turns Maths from intimidating to intuitive, reach out to our admissions team.
Admissions Open for 2026-27
What type of concept pages would you prefer?
CBSE Schools In Popular Cities
- CBSE Schools in Bangalore
- CBSE Schools in Mumbai
- CBSE Schools in Pune
- CBSE Schools in Hyderabad
- CBSE Schools in Chennai
- CBSE Schools in Gurgaon
- CBSE Schools in Kolkata
- CBSE Schools in Indore
- CBSE Schools in Sonipat
- CBSE Schools in Delhi
- CBSE Schools in Rohtak
- CBSE Schools in Bhopal
- CBSE Schools in Aurangabad
- CBSE Schools in Jabalpur
- CBSE Schools in Jaipur
- CBSE Schools in Jodhpur
- CBSE Schools in Nagpur
- CBSE Schools in Ahmednagar
- CBSE School In Tumkur


Orchids The International School is one of India's leading chains of CBSE and ICSE schools, with 110+ schools across the country.