

Empirical Relation between Mean, Median and Mode
The empirical relation between mean, median, and mode is one of statistics' most important shortcuts. It is a single formula that connects all three. The word "empirical" means "based on observation". In statistics, an empirical formula isn't derived from a rigid mathematical proof but from patterns that statisticians noticed in real-world data. The empirical relation between mean, median, and mode is a formula introduced by the statistician Karl Pearson, which helps you estimate one measure of central tendency when you know the other two, making data analysis easier and more practical. In this guide, you will learn the empirical relation between mean, median, and mode, along with the formula, explanation, and examples for easy understanding.
Table of Contents
- What is the Empirical Relation between Mean, Median, and Mode
- Relation between Mean, Median, and Mode in Frequency Distribution
- Solved Examples on the Empirical Relation between Mean, Median, and Mode
- Frequently Asked Questions on Empirical Relation between Mean, Median, and Mode

What is the Empirical Relation between Mean, Median, and Mode
Karl Pearson, a pioneer of modern statistics, studied the pattern across hundreds of real-world frequency distributions. He noticed that for any moderately skewed dataset, the gap between the mean and the mode is almost exactly three times the gap between the mean and the median. This insight led to what we now call the empirical relation. Karl Pearson’s Empirical relation:
Equivalent forms:
-
Mode = 3 Median − 2 Mean
-
3 Median = 2 Mean + Mode
Know more about related topics:
Relation between Mean, Median, and Mode in Frequency Distribution
The formula applies specifically to moderately skewed distributions. Here's how the three measures sit relative to each other in different distribution types:
Symmetrical Frequency Curve
If the frequency distribution has a perfectly symmetrical curve, the mean, median, and mode all coincide and have the same value. Data is balanced perfectly on both sides of the centre.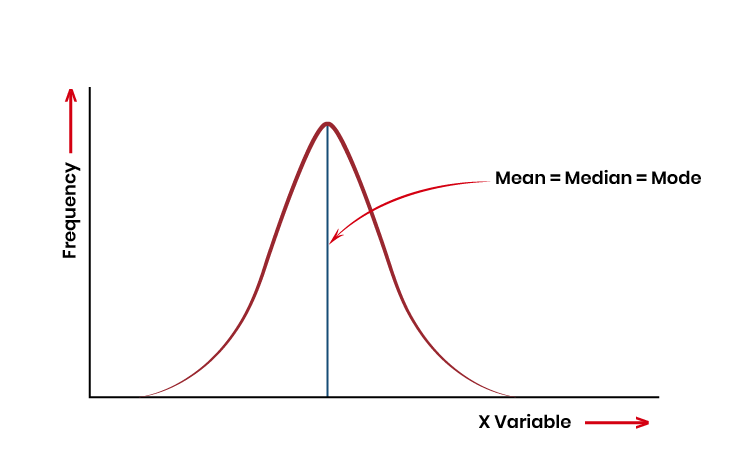
Mean = Median = Mode
Positively Skewed Frequency Distribution
In a positively skewed distribution, the mean is greater than the median and the median is greater than the mode. A very few high values pull the mean towards the right, creating a long tail on the right side of the distribution.
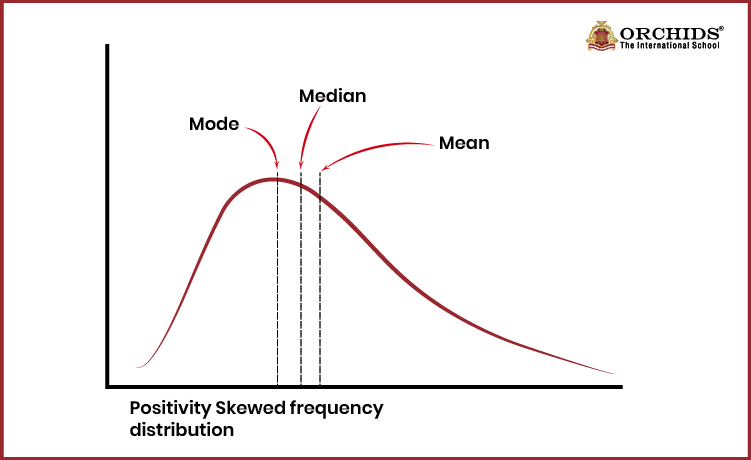
Mean > Median > Mode
Negatively Skewed Frequency Distribution
In a negatively skewed distribution, the mean is less than the median, and the median is less than the mode. A very few low values pull the mean towards the left, creating a long tail on the left side of the distribution
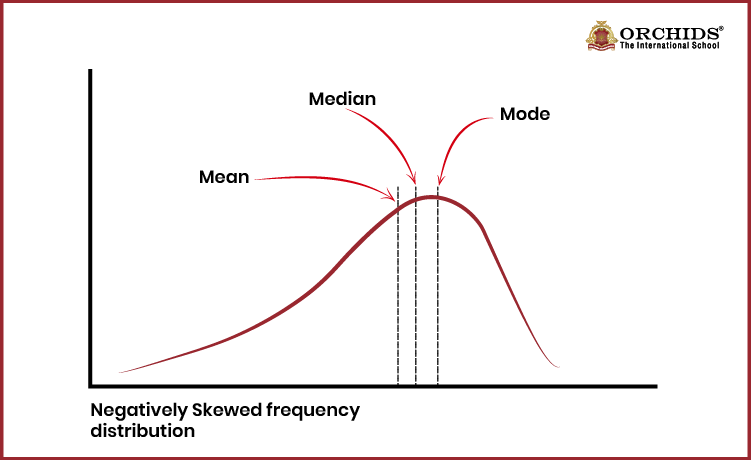
Mean < Median < Mode
Solved Examples on the Empirical Relation between Mean, Median, and Mode
Example 1: A distribution has mean = 50 and median = 45. Find the mode using the empirical formula.
Solution: Using Karl Pearson’s Empirical relation Mode = 3 Median − 2 Mean
Mode = 3(45) − 2(50) = 135 - 100 = 35
Mode = 35
Example 2: A distribution has a mean of 40.5 and a mode of 27. Find the median using the empirical formula.
Solution: Given, Mean = 40.5 and Mode = 27
Mode = 3 Median − 2 Mean 27 = 3 Median − 2(40.5)
Median = (27 + 81)/3 = 36.
Median = 36.
Example 3: A company HR report states that the median monthly salary of employees is ₹45,000 and the mean monthly salary is ₹52,000. Use the empirical relation to estimate the most common (modal) salary.
Solution: Given, median salary = ₹45,000 and mean salary = ₹52,000
Mode = 3 Median − 2 Mean
Modal Salary = 3(₹45,000) - 2(₹52,000) = ₹31,000
The most common (modal) salary is ₹31,000.
Numbers make sense when they're taught right. To see how Orchids The International School turns Maths from intimidating to intuitive, reach out to our admissions team.
Frequently Asked Questions on Empirical Relation between Mean, Median, and Mode
1. What is the empirical relation between mean, median and mode?
Yes. Each median of the triangle divides the triangle into two triangle of equal area.
2. Does the empirical relation apply to all distributions?
No. It only applies to moderately skewed frequency distributions. For a perfectly symmetrical distribution , Mean = Median = Mode.
3. What is the relation between mean, median and mode for a symmetrical distribution?
For a perfectly symmetrical distribution, Mean = Median = Mode.
Related Links


Admissions Open for 2026-27
What type of concept pages would you prefer?
CBSE Schools In Popular Cities
- CBSE Schools in Bangalore
- CBSE Schools in Mumbai
- CBSE Schools in Pune
- CBSE Schools in Hyderabad
- CBSE Schools in Chennai
- CBSE Schools in Gurgaon
- CBSE Schools in Kolkata
- CBSE Schools in Indore
- CBSE Schools in Sonipat
- CBSE Schools in Delhi
- CBSE Schools in Rohtak
- CBSE Schools in Bhopal
- CBSE Schools in Aurangabad
- CBSE Schools in Jabalpur
- CBSE Schools in Jaipur
- CBSE Schools in Jodhpur
- CBSE Schools in Nagpur
- CBSE Schools in Ahmednagar
- CBSE School In Tumkur











Orchids The International School is one of India's leading chains of CBSE and ICSE schools, with 110+ schools across the country.