
What is Inequality on a Number Line: Explained with Examples
Inequalities on a number line shows how to represent comparisons like <, >, ≤ and ≥ visually so anyone can quickly see which values satisfy a statement. This clear, academic yet approachable guide explains plotting single inequalities (for example x > 3), shading solution sets, and using open versus closed dots for strict and inclusive inequalities. It also covers compound statements (AND/OR) and interval notation on a single number line, highlights common mistakes (such as reversing the inequality when multiplying by a negative), and gives concise tips for converting algebraic inequalities into shaded regions. Use the step-by-step examples and practice prompts to build number sense and solve inequality problems confidently in mathematical and real‑world contexts.
Table of Contents
- Representing Inequalities on a Number Line
- Open Circles and Closed Circles on a Number Line
- Step-by-Step Method to Graph Inequality
- Compound Inequalities on a Number Line
- Reading an Inequality from a Diagram
- Solved Examples on Inequalities on a Number Line
- Frequently Asked Questions of Inequality on a Number Line

Representing Inequalities on a Number Line
When we graph an inequality on a number line, we are visually marking every value of x that makes the inequality true. Instead of listing infinitely many values, we shade a portion of the line.
There are two key visual tools used when plotting an inequality:
The Circle (at the boundary point)
The circle indicates whether or not the boundary value itself is part of the solution. This is the most important visual convention.
The Arrow or Shaded Line (the solution set)
After placing the circle, you shade the number line in the direction that satisfies the inequality:
-
Shade to the right for > or ≥ (values larger than the boundary)
-
Shade to the left for < or ≤ (values smaller than the boundary)
-
For compound inequalities, shade only between two boundary points
Know more about related topics:
Open Circles and Closed Circles on a Number Line
Open Circle ○:
Used with < and >. The boundary value is NOT a solution. It's like saying ‘up to but not including’.
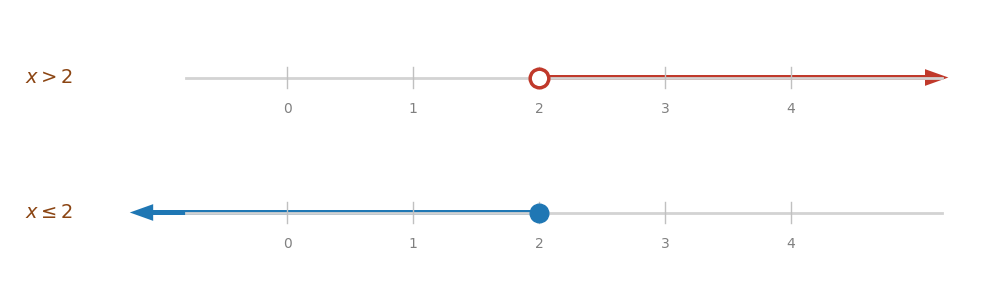
Example: x > 2: the value 2 itself is not allowed; only values strictly greater than 2.
Closed Circle ●:
Used with ≤ and ≥. The boundary value is included in the solution. It's like saying ‘up to and including’.
Example: x ≥ 2: the value 2 is valid, as are all values greater than 2.
Step-by-Step Method to Graph Inequality
Follow these four steps given below to graph any inequality:
-
Draw a horizontal number line
Mark relevant integers around your boundary value(s). Make sure there are at least two or three numbers on each side.
-
Identify the critical (boundary) point
This is the number the inequality is comparing x against. For x < 7, the critical point is 7.
-
Place the correct circle
-
Use an open circlefor < or >.
-
Use a closed circle (filled dot) for ≤ or ≥.
-
Shade in the correct direction
-
Shade right (with an arrow) if x is greater than the boundary.
-
Shade left (with an arrow) if x is less than the boundary.
Example: Graph x ≤ −1 on a number line.
Solution:
Step 1: The critical point is −1. Since the symbol is ≤, place a closed circle at −1.
Step 2: We want all values less than or equal to −1, so shade to the left.
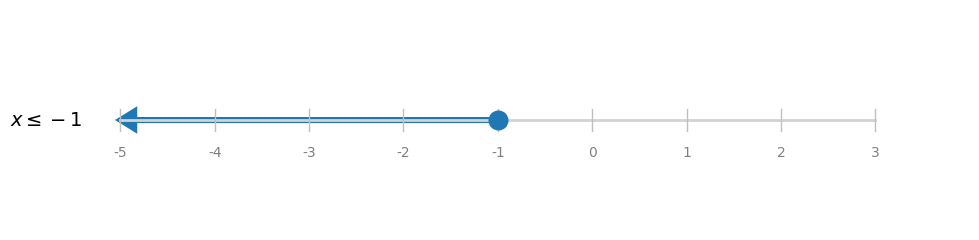
x ≤ −1: closed circle at −1, shading to the left
Compound Inequalities on a Number Line
A compound inequality (also called a double inequality) combines two conditions on a single variable. These are expressed in the form a < x < b or a ≤ x ≤ b, and they describe values of x lying strictly between two boundary points.
There are four possible combinations, depending on which endpoints are included:
For example: Graph −1 ≤ x < 4 on a number line.
Solution: x is less than or equal to −1 (closed circle at −1) and strictly less than 4 (open circle at 4). Shade the segment between them.
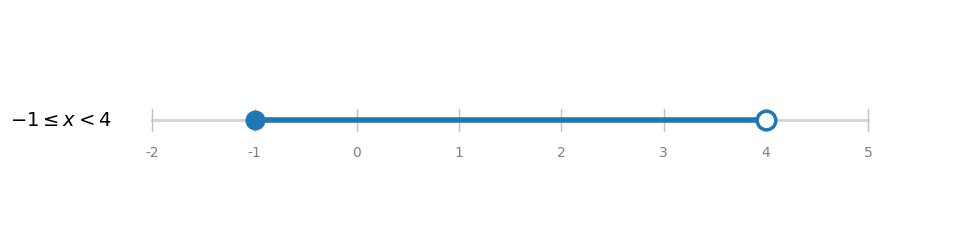
−1 ≤ x < 4; closed circle at −1, open circle at 4
Reading an Inequality from a Diagram
Here's how to read inequality from a diagram:
-
Identify the boundary point(s)
Read off the number(s) where the circle(s) are placed.
-
Check: open or closed?
Open circle → use < or >. Closed circle → use ≤ or ≥.
-
Check the direction of shading
Shaded right → > or ≥. Shaded left → < or ≤. Shaded between two points → compound inequality.
Example: Write the inequality shown:
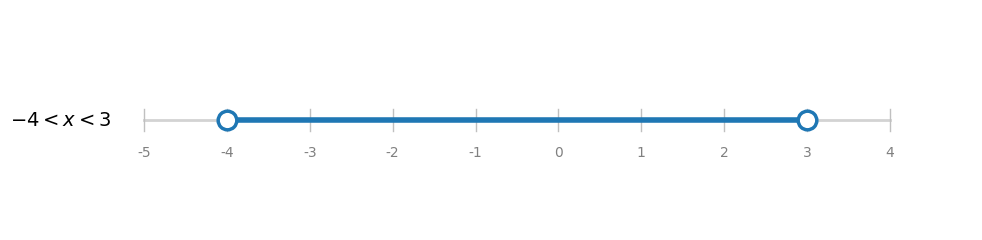
Solution: Open circle at −4, open circle at 3, shaded segment between them.
Both circles open = neither endpoint included. It's a compound inequality. Answer: −4 < x < 3
Solved Examples on Inequalities on a Number Line
Example 1: Graph −3 < x < 2 on a number line.
Solution:
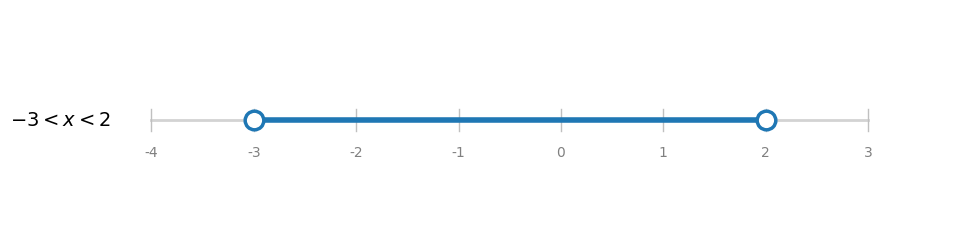
−3 < x < 2: open circles at both endpoints
Example 2: Graph 10 < x < 19 on a number line.
Solution:
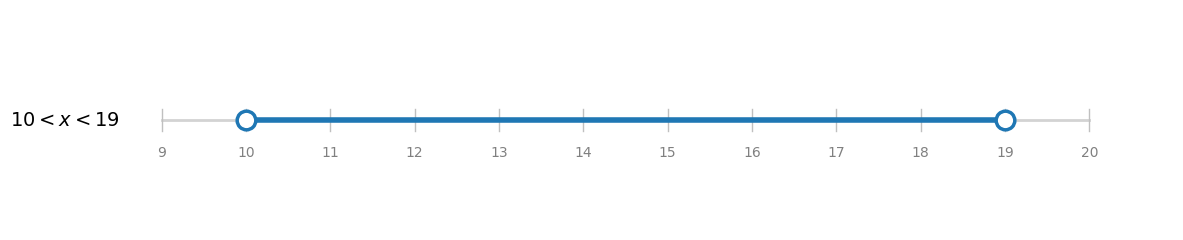
For 10 < x < 19: an open circle at 10, an open circle at 19
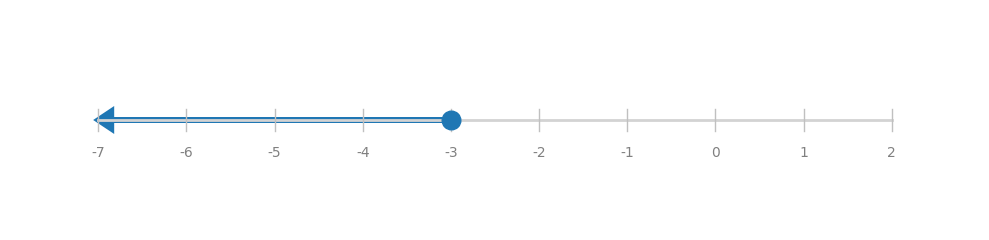
Example 3: Solve 3(x – 1) ≤ 2 (x – 3)
Solution: Solve the inequality: 3(x−1) ≤ 2(x−3)
Expand both sides: 3x−3 ≤ 2x−6
Subtract 2x from both sides: x−3 ≤ −6
Add 3 to both sides: x ≤ −3
Numbers make sense when they're taught right. To see how Orchids The International School turns Maths from intimidating to intuitive, reach out to our admissions team.
Frequently Asked Questions of Inequality on a Number Line
1. What is the difference between an open circle and a closed circle on a number line?
An open circle (○) at a boundary point means that value is not included in the solution set, it corresponds to strict inequalities (< or >). A closed circle (●) means the value is included, it corresponds to ≤ or ≥.
2. How do I know which direction to shade?
A simple rule: if x is greater than the boundary, shade to the right. If x is less than the boundary, shade to the left.
3. Does the inequality sign flip when I solve it?
Yes. But only when you multiply or divide both sides of an inequality by a negative number.
4. Can inequalities have no solution?
Yes. A contradiction like x > 5 AND x < 2 simultaneously has no solution, because no real number can be both greater than 5 and less than 2 at the same time.
Related Links
Admissions Open for 2026-27
What type of concept pages would you prefer?
CBSE Schools In Popular Cities
- CBSE Schools in Bangalore
- CBSE Schools in Mumbai
- CBSE Schools in Pune
- CBSE Schools in Hyderabad
- CBSE Schools in Chennai
- CBSE Schools in Gurgaon
- CBSE Schools in Kolkata
- CBSE Schools in Indore
- CBSE Schools in Sonipat
- CBSE Schools in Delhi
- CBSE Schools in Rohtak
- CBSE Schools in Bhopal
- CBSE Schools in Aurangabad
- CBSE Schools in Jabalpur
- CBSE Schools in Jaipur
- CBSE Schools in Jodhpur
- CBSE Schools in Nagpur
- CBSE Schools in Ahmednagar
- CBSE School In Tumkur


Orchids The International School is one of India's leading chains of CBSE and ICSE schools, with 130+ schools across the country.