
More than and Less than Ogive: Differences, Graphs and Examples
A ‘more than’ and ‘less than’ ogive is a helpful graph in statistics that helps to understand how data accumulates across values. Instead of focusing on single class frequencies, these graphs show cumulative frequencies, either adding up from the smallest class upward for less than ogive or from the largest class downward for more than ogive. In this guide, you’ll learn about the meaning of ogives, the difference between more than and less than ogives, and how to draw and interpret them with confidence.
Table of Contents
- What Is a Less Than Ogive?
- What Is a More Than Ogive?
- Finding the Median Using the Ogive
- Frequently Asked Questions of Less Than Ogive and More Than Ogive

What Is a Less Than Ogive?
Less Than Ogive also called the ‘Less Than Cumulative Frequency Curve’ is constructed by progressively adding up frequencies from the lowest class interval to the highest. The result is an upward-sloping, S-shaped curve that rises steadily from left to right, starting near zero and ending at the total frequency.
How to Draw a Less Than Ogive (Step-by-Step)
Step 1: Draw and label the horizontal (X) and vertical (Y) axes.
Step 2: Plot the upper class limits on the X-axis.
Step 3: Plot the corresponding less than cumulative frequencies on the Y-axis.
Step 4: Mark each point on the graph where the upper class limit meets its cumulative frequency.
Step 5: Join all the plotted points with a smooth, freehand curve.
Example: The marks obtained by 50 students in a class test are given below. Construct both Less Than Ogive curve.
Cumulative frequency table:
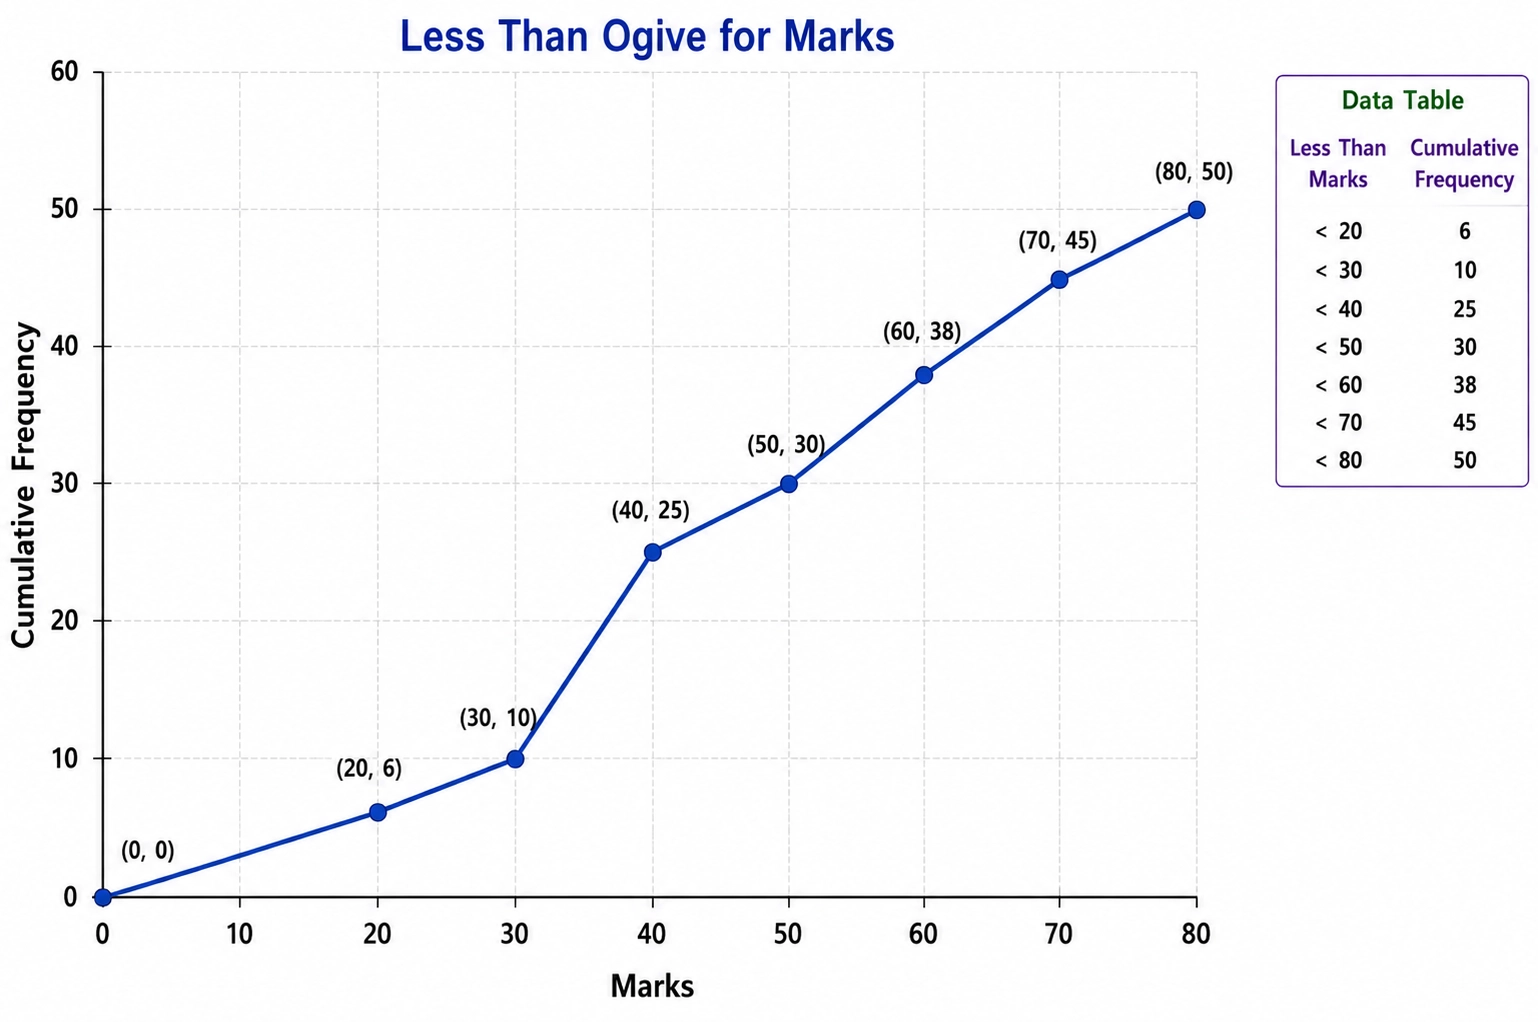
The cumulative frequency steadily rises with each row, ending at 50.
What Is a More Than Ogive?
More Than Ogive also called the ‘Greater Than Cumulative Frequency Curve’ works in the opposite direction. Instead of adding up from the left, you start from the total and subtract frequencies as you move up through the class intervals. The result is a downward-sloping curve that begins at the total frequency and gradually falls to zero as you move from left to right.
How to Draw a More-Than-Ogive (Step-by-Step)
Step 1: Draw and label the horizontal (X) and vertical (Y) axes.
Step 2: Plot the lower class limits on the X-axis.
Step 3: Plot the corresponding more than cumulative frequencies on the Y-axis.
Step 4: Mark each point on the graph where the lower class limit meets its cumulative frequency.
Step 5: Join all the plotted points with a smooth, freehand curve.
Example: The marks obtained by 50 students in a class test are given below. Construct both More Than Ogive curve.
Cumulative frequency table:
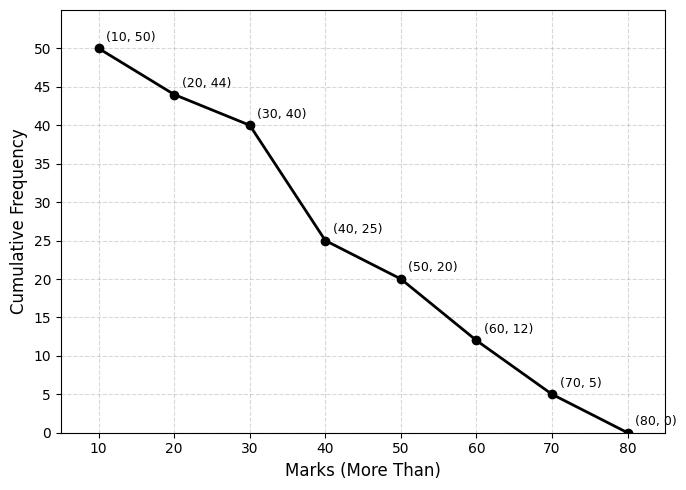
Here, the cumulative frequency starts at 50 and falls steadily.
Finding the Median Using the Ogive
When both curves are plotted on the same axes:
-
The Less Than Ogive rises from bottom-left to top-right.
-
The More Than Ogive falls from top-left to bottom-right.
-
They intersect at exactly one point.
The x-coordinate of the intersection is the median, and the y-coordinate is N/2.
Why does this intersection give the median?
At the median, exactly half the observations lie below it and half lie above it. In terms of cumulative frequency:
-
The ‘less than’ cumulative frequency at the median = N/2
-
The ‘more than’ cumulative frequency at the median = N/2
Since both equal N/2 at the median, the two curves cross precisely at that point. The x-coordinate of the intersection is the median, and the y-coordinate is N/2.
In the example above, when you plot both sets of points on the same graph the two curves cross each other at exactly one point. Drop a perpendicular from that intersection point to the X-axis, and you get the Median of the data set.
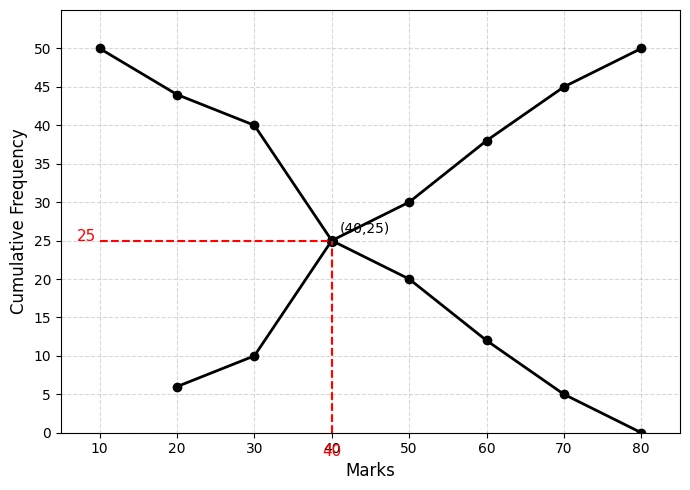
The two curves intersect at approximately x = 40, which means the median marks of the 50 students is approximately 40.
Frequently Asked Questions of Less Than Ogive and More Than Ogive
1. What is the difference between Less Than Ogive and More Than Ogive?
A Less Than Ogive is a rising curve plotted using upper class limits and less than cumulative frequencies. A More Than Ogive is a falling curve plotted using lower class limits and more than cumulative frequencies.
2. Where do the Less Than and More Than Ogive curves intersect?
They intersect at the Median of the data set. The x-coordinate at the point of intersection gives the median, and the y-coordinate is N/2.
3. What is the shape of an Ogive curve?
Both ogives are S-shaped curves. The Less Than Ogive looks like a regular S, while the More Than Ogive looks like a reversed or inverted S.
4. What is the cumulative frequency at the intersection of both Ogives?
At the point of intersection, both Ogives share the same cumulative frequency value = N/2, where N is the total number of observations.
Numbers make sense when they're taught right. To see how Orchids The International School turns Maths from intimidating to intuitive, reach out to our admissions team.
Admissions Open for 2026-27
What type of concept pages would you prefer?
CBSE Schools In Popular Cities
- CBSE Schools in Bangalore
- CBSE Schools in Mumbai
- CBSE Schools in Pune
- CBSE Schools in Hyderabad
- CBSE Schools in Chennai
- CBSE Schools in Gurgaon
- CBSE Schools in Kolkata
- CBSE Schools in Indore
- CBSE Schools in Sonipat
- CBSE Schools in Delhi
- CBSE Schools in Rohtak
- CBSE Schools in Bhopal
- CBSE Schools in Aurangabad
- CBSE Schools in Jabalpur
- CBSE Schools in Jaipur
- CBSE Schools in Jodhpur
- CBSE Schools in Nagpur
- CBSE Schools in Ahmednagar
- CBSE School In Tumkur


Orchids The International School is one of India's leading chains of CBSE and ICSE schools, with 110+ schools across the country.