
HOTS Questions on Class 10 Maths Chapter 13 ‘Statistics’ with Answers
Higher‑Order Thinking Skills (HOTS) question set for Class 10 Maths Chapter 13: ‘Statistics’ is designed to move students beyond routine calculations and cultivate problem‑solving abilities using statistical reasoning. Aligned with CBSE and NCERT learning outcomes, the tasks emphasise conceptual understanding of measures of central tendency, empirical relation and interpretation and representation of data. Each question includes a clear answer and brief reasoning to support classroom discussion and self-study. Download the PDF to access the same HOTS questions in a printable format, making offline learning and exam revision easier.
Solved HOTS Questions on Statistics
Question 1: The mean of the following distribution is 18. Find the value of f.
Solution:
Class midpoints (xᵢ): 12, 14, 16, 18, 20, 22, 24
Σf = 3 + 6 + 9 + 13 + f + 5 + 4 = 40 + f
Σfᵢxᵢ = 3(12) + 6(14) + 9(16) + 13(18) + f(20) + 5(22) + 4(24)
= 36 + 84 + 144 + 234 + 20f + 110 + 96
= 704 + 20f
Mean = Σfᵢxᵢ/Σf
⇒ 18 = (704 + 20f)/(40 + f)
18(40 + f) = 704 + 20f
⇒ 720 + 18f = 704 + 20f
⇒ 16 = 2f
∴ f = 8
Question 2: A student computes the average of 10 two-digit positive integers. By mistake, one number's digits are swapped. This makes the mean 2.7 less than the original. Find the difference between the digits of that number.
Solution:
Let the digits of the wrongly-written number be 'a' (tens) and 'b' (units), so the number is 10a+b. When swapped, it becomes 10b+a.
Difference in the number = (10a+b) – (10b+a) = 9(a–b)
This reduces the total sum by 9(a–b), so mean reduces by 9(a–b)/10 = 2.7
9(a–b) = 27 ⇒ a–b = 3
∴ Difference between digits = 3
Question 3: The mean of 11 numbers is 35. The mean of the first 6 numbers is 32 and the mean of the last 6 numbers is 37. Find the 6th number.
Solution:
Sum of all 11 = 35 × 11 = 385
Sum of first 6 = 32 × 6 = 192
Sum of last 6 = 37 × 6 = 222
Sum of first 6 + Sum of last 6 = 192 + 222 = 414, but this counts the 6th number twice.
414 = 385 + 6th number
⇒ 6th number = 414 – 385
∴ 6th number = 29
Question 4: The median of the following frequency distribution is 35. Find the value of x and also identify the modal class.
Solution:
Σf = 2 + 3 + x + 6 + 5 + 3 + 2 = 21 + x.
Since median = 35 lies in 30–40, median class = 30–40.
cf before 30 - 40 = 2 + 3 + x = 5 + x
f = 6; l = 30; h = 10; n/2 = (21 + x)/2
35 = 30 + [((21 + x)/2 – (5 + x)) / 6] × 10
5 = [(21 + x – 10 – 2x)/2 / 6] × 10
⇒ 5 = [(11 – x)/12] × 10
⇒ 6 = (11 – x) × 10/12
⇒ 6×12 = 10(11 – x)
⇒ 72 = 110 – 10x
⇒ 10x = 38
⇒ x = 3.8 ≈ 4 (round to nearest whole number or exact value x = 4)
With x = 4: frequencies are 2,3,4,6,5,3,2
⇒ Maximum frequency = 6 in class 30 - 40.
∴ x = 4, Modal Class = 30 - 40
Question 5: The mean of the following data is 62.8 and the total number of observations is 50. Find the missing frequencies f₁ and f₂.
Solution:
Σf = 5 + f₁ + 10 + f₂ + 7 + 8
= 30 + f₁ + f₂ = 50
⇒ f₁ + f₂ = 20 …(i)
xᵢ: 10, 30, 50, 70, 90, 110
⇒ Σfᵢxᵢ = 5(10) + f₁(30) + 10(50) + f₂(70) + 7(90) + 8(110)
= 50 + 30f₁ + 500 + 70f₂ + 630 + 880
= 2060 + 30f₁ + 70f₂
Mean = 62.8
⇒ 62.8 = (2060 + 30f₁ + 70f₂)/50
⇒ 3140 = 2060 + 30f₁ + 70f₂
⇒ 30f₁ + 70f₂ = 1080
⇒ 3f₁ + 7f₂ = 108 …(ii)
From (i): f₁ = 20 – f₂.
Substituting in (ii): 3(20 – f₂) + 7f₂ = 108
⇒ 60 – 3f₂ + 7f₂ = 108
⇒ 4f₂ = 48
⇒ f₂ = 12
∴ f₁ = 8, f₂ = 12
Question 6: The weights of 35 students of a class were recorded as a cumulative frequency distribution as shown below. Draw a 'less than' type ogive and find the median weight from the graph. Verify using the formula.
Solution:
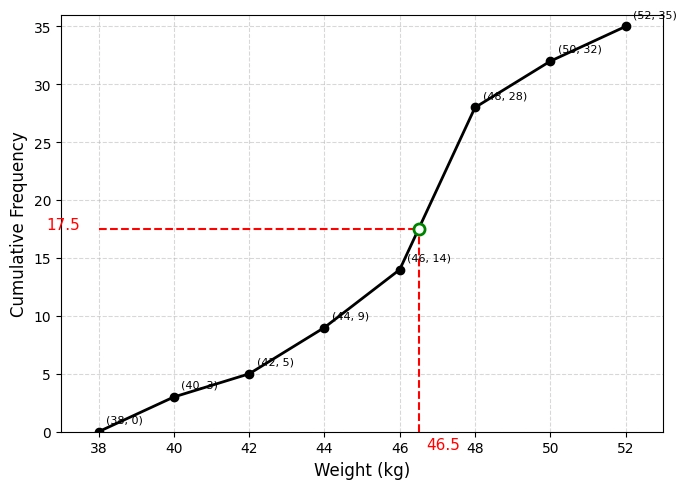
From graph: n/2 = 35/2 = 17.5.
Draw a horizontal line at y = 17.5. Where it meets the ogive, drop a perpendicular to the x-axis. The x-value gives the median ≈ 46.5 kg.
Verification using formula:
Convert to frequency table:
n/2 = 17.5
⇒ cf just ≥ 17.5 is 28
⇒ Median class = 46–48.
l = 46, cf = 14, f = 14, h = 2
⇒ Median = 46 + [(17.5–14)/14] × 2
= 46 + (3.5/14)×2
= 46 + 0.5
= 46.5 kg
∴ Median Weight = 46.5 kg
Question 7: he following table gives the distribution of income of 100 families in a town. Draw 'less than' and 'more than' ogives for this data. Use the graph to find the median income. Also verify using the formula.
Solution:

From the graph: The two ogives intersect at approx. x = 243.
Draw perpendicular to x-axis
⇒ Median ≈ ₹243 thousand.
Formula verification: n = 100, n/2 = 50
⇒ cf just ≥ 50 is 53
⇒ Median class = 200 - 250.
l = 200, cf = 28, f = 25, h = 50
⇒ Median = 200 + [(50–28)/25]×50
= 200 + (22/25)×50
= 200 + 44 = ₹244 thousand
∴ Median Income ≈ ₹243 - 244 thousand

Download Free PDF: HOTS Questions - Class 10 Chapter 13 - Statistics
Download PDF - Class 10 Chapter 13: Statistics HOTS Questions
Read More:
- Statistics Notes Page
Class 10 Maths Notes Chapter 13 Statistics - Statistics Important Questions Page
Important Questions Class 10 Maths Statistics - Statistics MCQs Page
Class 10 Maths Mcqs Chapter 13 Statistics - Statistics Worksheets Page
Class 10 Maths Chapter 13 Statistics Worksheets - Statistics NCERT Solutions Page
Class 10 Maths Ncert Solutions Chapter 13 Statistics - Statistics Assertion Reason Page
Assertion Reason Questions For Class 10 Maths Chapter 13 Statistics - Statistics Case Study Page
Case Study Questions on Maths Class 10 Chapter 13 Statistics
Frequently Asked Questions of HOTS Questions on Chapter 13: Statistics for Class 10
1. How do you find median from two ogives?
Draw both the 'less than' ogive and the 'more than' ogive on the same graph. The x-coordinate (abscissa) of their point of intersection gives the median of the distribution.
2. What is the difference between ‘more than ogive’ and ‘less than ogive’?
A 'less than' ogive is plotted using the upper class limits on the x-axis against cumulative frequency. A 'more than' ogive is plotted using the lower class limits on the x-axis against cumulative frequency.
3. What type of HOTS questions come from statistics in Class 10 Board exams?
HOTS questions in Statistics typically involve finding missing frequencies using given mean/median/mode, using the empirical relationship interpreting the ogive intersection point and real life scenarios.
4. What is the empirical relationship between the three measures of central tendency?
Mode = 3 Median - 2 Mean
Numbers make sense when they're taught right. To see how Orchids The International School turns Maths from intimidating to intuitive, reach out to our admissions team.
Admissions Open for 2026-27
What type of concept pages would you prefer?
CBSE Schools In Popular Cities
- CBSE Schools in Bangalore
- CBSE Schools in Mumbai
- CBSE Schools in Pune
- CBSE Schools in Hyderabad
- CBSE Schools in Chennai
- CBSE Schools in Gurgaon
- CBSE Schools in Kolkata
- CBSE Schools in Indore
- CBSE Schools in Sonipat
- CBSE Schools in Delhi
- CBSE Schools in Rohtak
- CBSE Schools in Bhopal
- CBSE Schools in Aurangabad
- CBSE Schools in Jabalpur
- CBSE Schools in Jaipur
- CBSE Schools in Jodhpur
- CBSE Schools in Nagpur
- CBSE Schools in Ahmednagar
- CBSE School In Tumkur


Orchids The International School is one of India's leading chains of CBSE and ICSE schools, with 110+ schools across the country.