
Data Handling for Class 1: Easy Guide with Examples
Data Handling for Class 1 introduces young learners to the simple idea that we can collect, organise, and talk about information to answer everyday questions. This short introduction uses familiar, playful examples like counting how many red apples are in a basket, sorting toys by type, or making a picture of classmates’ favourite colours so children see data as things we notice and share. The guide focuses on simple actions of collecting, sorting and counting, clear visuals and everyday language to build early skills in observation, comparison, and number sense.
Table of Contents
- Introduction to Data Handling for Class 1
- Sorting Data for Class 1
- Understanding Pictographs for Class 1
- Frequently Asked Questions of Data Handling for Class 1

Introduction to Data Handling for Class 1
Simply put, data is information, and handling data means making sense of that information. For Class 1 students, this means counting things carefully and then asking, 'Which has more?' ‘Which has less?’.
Sorting Data for Class 1
Sorting of data means the arrangement of data in an organised manner. When we sort data, it becomes easier to count, compare, and understand.
Consider the following example: Raj and his went to a birthday party and took the picture below. Let us sort out the different foods they ate.
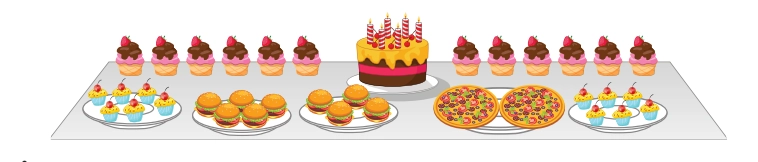
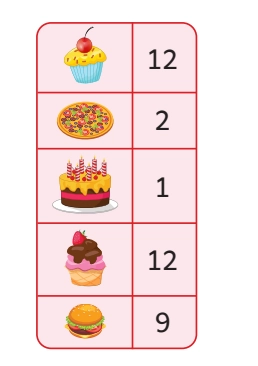
Here is the sorted data of different types of food.
Sorting helps children organise information before using tally marks, tables, or pictographs. It also improves observation, counting, and comparison skills.
Understanding Pictographs for Class 1
A pictograph is simply a way of showing data using pictures. One picture equals one item. A pictograph shows data in a table using pictures.
Example 1: Here is the pictograph of ‘What fruit did class 1A bring for tiffin?’
Just by looking at this pictograph, a Class 1 child can instantly see that mango is the most popular tiffin fruit and orange is the least popular.
Look at the fruit pictograph above and answer the following questions:
1. Which fruit is the most popular?
Answer: Mango - 7 children
2. Which fruit is the least popular?
Answer: Orange - 2 children
3. How many children brought apple?
Answer: 5 children
4. How many children are in the class?
Answer: 5 + 3 + 7 + 2 = 17 children
Example 2: Rohan and Aditya planted some saplings. Look at the
pictograph and answer the questions given below.
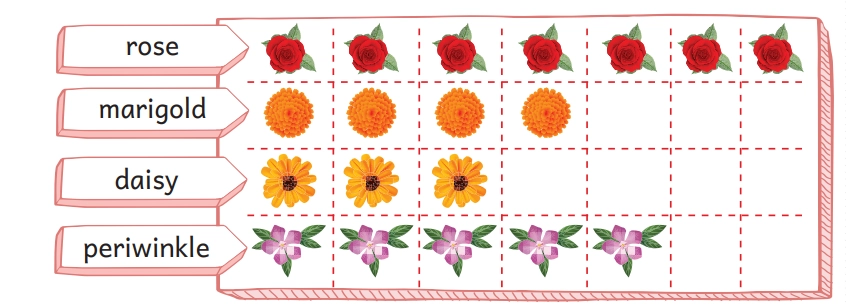
a.Which sapling did they plant the most?
Answer: Rose - 7 saplings
b. Which sapling did they plant the least?
Answer: Daisy - 3 saplings
c. How many more periwinkle saplings did they plant than daisies?
Answer: Periwinkle = 5 saplings
Daisy = 3 saplings
5 - 3 = 2. They planted 2 more periwinkle saplings than daisy.
d. How many fewer marigold saplings did they plant than roses?
Answer: Marigold = 4 saplings
Rose = 7 saplings
7 - 4 = 3. They planted 3 fewer marigold saplings than roses.
e. How many marigold and daisy saplings did they plant in total?
Answer: Marigold = 4 saplings
Daisy = 3 saplings
4 + 3 = 7. In total 7 marigold and daisy saplings were planted
f. Find the total number of saplings planted.
Daisy = 3 saplings
Marigold = 4 saplings
Rose = 7 saplings
Periwinkle = 5 saplings
Total = 3 + 4 + 7 + 5 = 19 saplings
Here's a set of questions for practice.
Practice Worksheet: Data Handling for Class 1 (Free Download). Improve your maths skills with this Data Handling for Class 1 worksheet.
Frequently Asked Questions of Data Handling for Class 1
1. What is data handling for Class 1?
Data handling for Class 1 means collecting simple information, sorting it into groups, and figuring out what it tells us.
2. How to explain Data handling to a 6 year old?
Tell your child: "Data means information. When we count how many apples and bananas are in the basket, that's data. When we figure out which fruit is more, we're handling data." Use everyday objects like crayons, fruits, toys to make it feel like a game. Keep connecting to things the child already knows and cares about.
3. What are some fun data handling activities for Class 1?
Some fun activities include: sorting a box of crayons by colour and counting each group; asking classmates their favourite fruit and recording tallies on the board; making a simple pictograph of how children come to school and counting letters in everyone's name etc.
4. What is pictograph for Class 1?
A pictograph uses pictures or drawings to show data. In Class 1, one picture equals one item. For example, if 4 children like mangoes, you draw 4 mango pictures in a row.
Numbers make sense when they're taught right. To see how Orchids The International School turns Maths from intimidating to intuitive, reach out to our admissions team.
Admissions Open for 2026-27
What type of concept pages would you prefer?
CBSE Schools In Popular Cities
- CBSE Schools in Bangalore
- CBSE Schools in Mumbai
- CBSE Schools in Pune
- CBSE Schools in Hyderabad
- CBSE Schools in Chennai
- CBSE Schools in Gurgaon
- CBSE Schools in Kolkata
- CBSE Schools in Indore
- CBSE Schools in Sonipat
- CBSE Schools in Delhi
- CBSE Schools in Rohtak
- CBSE Schools in Bhopal
- CBSE Schools in Aurangabad
- CBSE Schools in Jabalpur
- CBSE Schools in Jaipur
- CBSE Schools in Jodhpur
- CBSE Schools in Nagpur
- CBSE Schools in Ahmednagar
- CBSE School In Tumkur


Orchids The International School is one of India's leading chains of CBSE and ICSE schools, with 130+ schools across the country.