
Class 9 Maths Chapter 7 ‘The Mathematics of Maybe: Introduction to Probability ’ Notes: Complete Guide for CBSE Board Exams
Chapter 7 ‘The Mathematics of Maybe: Introduction to Probability’ Class 9 NCERT-aligned notes help build a strong foundation in probability. This chapter introduces essential probability ideas using simple language, relatable examples, and CBSE-style explanations designed for board exam and unit-test success. These notes start with key definitions and then move to computation using favourable outcomes over total outcomes, including equally likely cases. Learn how to express probability as a fraction, decimal, or percentage, and practise standard methods for converting experimental (empirical) probability from data and comparing it with theoretical probability.
Table of Contents
- Key Definitions in Probability
- Sample Space and Events
- Visualising All Possible Outcomes: Tree Diagrams
- Empirical Probability: Formula and Examples
- Theoretical Probability: Formula and Examples
- Complementary Events: Formula and Examples
- Frequently Asked Questions of Chapter 7: The Mathematics of Maybe: Introduction to Probability Notes for Class 9

Key Definitions in Probability
- The Probability Scale
Probability is expressed as a number from 0 to 1.
0 ≤ P(E) ≤ 1
The probability of any event is always between 0 (impossible) and 1 (certain), inclusive.
-
Subjective vs. Objective Thinking
Sometimes people make predictions based on personal feelings like ‘It looks dark outside, so it will probably rain’.This is called a subjective judgment. But when predictions are made using actual data, patterns, or mathematical reasoning, they are objective. In mathematics, probability is always objective.
Know more about related topics:
- Class 9 Maths Mcqs Chapter 7 The Mathematics Of Maybe Introduction To Probability
- Class 9 Maths Case Study Chapter 7 The Mathematics Of Maybe Introduction To Probability
- Important Questions Class 9 Maths The Mathematics Of Maybe Introduction To Probability
- Assertion Reason Questions For Class 9 Maths Chapter 7 The Mathematics Of Maybe Introduction To Probability
- Probability
Sample Space and Events
The sample space (S) is the complete list of all possible outcomes of a random experiment, written as a set.
🪙1 Coin Toss
-
S = {H, T}
-
Number of outcomes = 2
🪙🪙 2 Coins Tossed
-
S = {HH, HT, TH, TT}
-
Number of outcomes = 4
🎲 1 Die Rolled
-
S = {1, 2, 3, 4, 5, 6}
-
Number of outcomes = 6
🎲🎲 2 Dice Rolled
-
S = {(1,1), (1,2), … (6,6)}
-
Number of outcomes = 36
What is an Event?
An event is a subset of the sample space. It is the specific outcome or group of outcomes we are looking for. For example, if we roll a die and define Event E as ‘getting an even number’,then E = {2, 4, 6}.
Visualising All Possible Outcomes: Tree Diagrams
A tree diagram is a visual tool used to systematically list all possible outcomes of a multi-step random experiment. Each branch represents one possible outcome at that stage. By following every path from start to finish, you get the complete sample space.
Tree Diagram: Tossing a Coin Twice
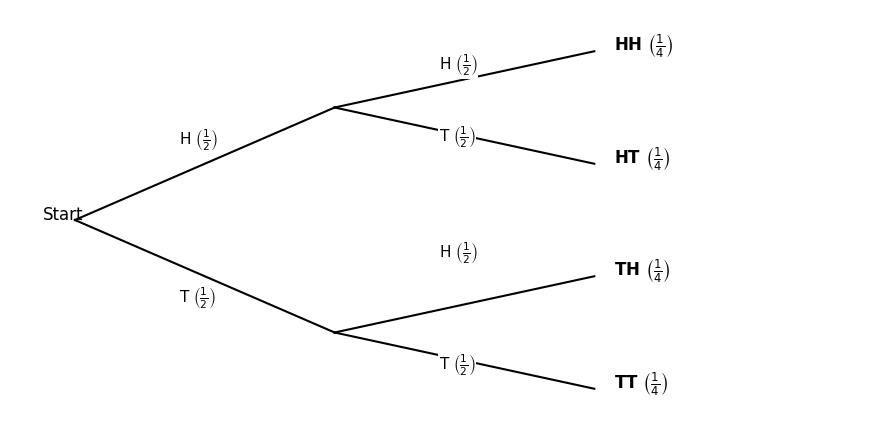
Total outcomes = 2 × 2 = 4. Each outcome has probability ½ × ½ = ¼.
This confirms that tossing 2 coins gives 4 equally likely outcomes.
Tree Diagram: Tossing a Coin Three Times
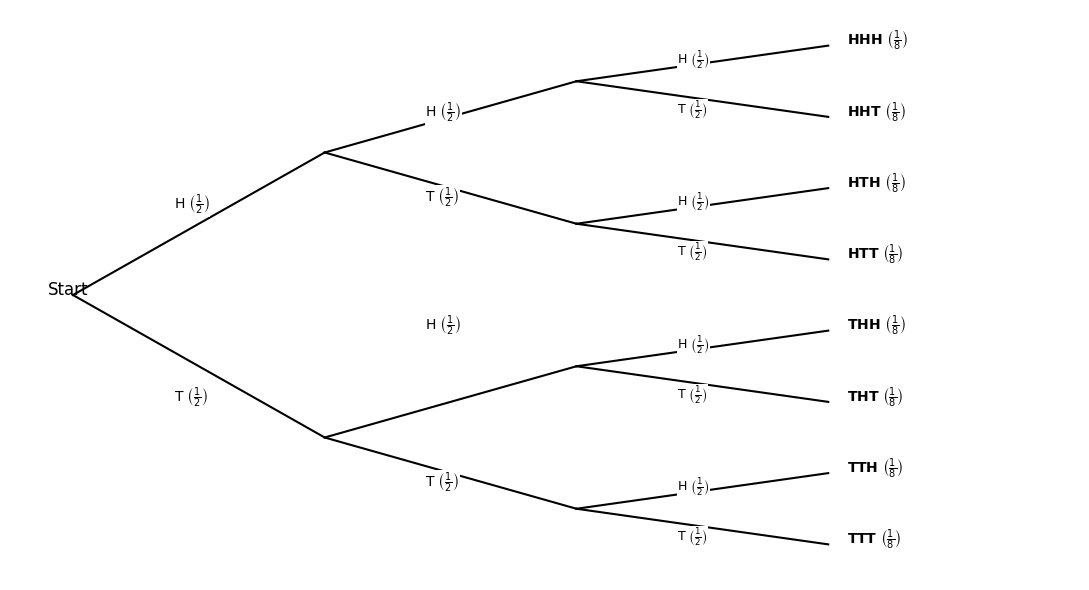
When a coin is tossed three times, we get 2 × 2 × 2 = 8 outcomes.
Sample Space: S = {HHH, HHT, HTH, HTT, THH, THT, TTH, TTT}
Total = 8 outcomes
Each has probability = ½ × ½ × ½ = ⅛
If you have n steps, each with k equally likely outcomes, the total number of outcomes = k^n. For 3 coin tosses: 2^3 = 8. For 2 dice: 6^2 = 36.
Empirical Probability: Formula and Examples
Experimental probability, also called empirical probability, is calculated by actually performing an experiment and recording what happens.
Formula:
P(E) = Number of times event E occurs ÷ Total number of trials
Example:
A bag of 1000 tomatoes is inspected. 40 are found to be rotten. What is the probability that a randomly picked tomato is (i) rotten (ii) good?
Solution: Total tomatoes (n) = 1000
Number of rotten tomatoes = 40
Number of good tomatoes = 1000 − 40 = 960
(i) P(rotten) = 40/1000 = 1/25 = 0.04
(ii) P(good) = 960/1000 = 24/25 = 0.96
P(rotten) + P(good) = 0.04 + 0.96 = 1
Theoretical Probability: Formula and Examples
Theoretical probability is calculated without performing any experiment. It uses mathematical reasoning and assumes that all outcomes in the sample space are equally likely.
Formula:
P(E) = Number of favourable outcomes ÷ Total number of possible outcomes
This formula works only when all outcomes are equally likely (fair coin, unbiased die, well-shuffled cards).
Key Properties of Theoretical Probability
-
P(impossible event) = 0 (e.g., rolling 7 on a standard die)
-
P(sure/certain event) = 1 (e.g., rolling a number ≤ 6 on a die)
-
0 ≤ P(E) ≤ 1 for any event E
-
Sum of probabilities of all outcomes = 1
-
P(Ē) = 1 − P(E), where Ē is the complement of E
Example: Two fair coins are tossed simultaneously. Find the probability of getting:
(i) exactly 2 Heads
(ii) exactly 1 Head
(iii) at least 1 Head
(iv) no Heads.
Solution: Sample Space: S = {HH, HT, TH, TT}
Total outcomes = 4
(i) Exactly 2 Heads: {HH}, P = 1/4
(ii) Exactly 1 Head: {HT, TH}, P = 2/4 = 1/2
(iii) At least 1 Head: {HH, HT, TH}, P = 3/4
(iv) No Heads (2 Tails): {TT}, P = ¼
Example: Two dice are thrown simultaneously. Find the probability that:
(i) the sum is 7
(ii) the sum is 8
(iii) both show the same number
(iv) sum > 10.
Solution: Total outcomes = 6 × 6 = 36
(i) Sum = 7: (1,6), (2,5), (3,4), (4,3), (5,2),(6,1); P = 6/36 = 1/6
(ii) Sum = 8: (2,6), (3,5), (4,4), (5,3), (6,2); P = 5/36
(iii) Both same: (1,1), (2,2), (3,3), (4,4), (5,5), (6,6); P = 6/36 = 1/6
(iv) Sum > 10: (5,6), (6,5), (6,6); P = 3/36 = 1/12
Example: A card is drawn from a well-shuffled deck of 52 cards. Find the probability of drawing:
(i) a Queen
(ii) a red card
(iii) a black King
(iv) a face card
(v) neither a Jack nor a King.
Solution: Total outcomes = 52
(i) Queens = 4 (one per suit); P = 4/52 = 1/13
(ii) Red cards = 26 (♥ + ♦); P = 26/52 = 1/2
(iii) Black Kings = 2 (K♠ and K♣); P = 2/52 = 1/26
(iv) Face cards = 12 (4J + 4Q + 4K); P = 12/52 = 3/13
(v) Jacks = 4, Kings = 4, total J or K = 8.
Remaining = 52 − 8 = 44; P = 44/52 = 11/13
Complementary Events: Formula and Examples
The complement of an event E, written as Ē (read as "E bar"), is the event that E does NOT happen. Together, E and Ē cover all possibilities in the sample space.
P(E) + P(Ē) = 1 ⟹ P(Ē) = 1 − P(E)
Example: In a class of 30 students, 6 are class monitors. If one student is selected at random, find:
(i) P(selected is a monitor)
(ii) P(selected is NOT a monitor).
Solution: Total students = 30, Monitors = 6
(i) P(monitor) = 6/30 = 1/5 = 0.2
(ii) P(not a monitor) = 1 − 1/5 = 4/5 = 0.8
Click below to download your free Class 9 Chapter 7: The Mathematics of Maybe: Introduction to Probability PDF Notes perfect for last-minute CBSE board exam revision.
Download PDF - Class 9 Chapter 7: The Mathematics of Maybe: Introduction to Probability Notes
Frequently Asked Questions of Chapter 7: The Mathematics of Maybe: Introduction to Probability Notes for Class 9
1. Can the probability be greater than 1?
No, probability can never be greater than 1. Probability is always between 0 and 1, inclusive (0 ≤ P(E) ≤ 1).
2. Why does sample space of 2 coins have 4 outcomes not 3?
When tossing 2 coins, HT (1st coin = Heads, 2nd coin = Tails) and TH (1st coin = Tails, 2nd coin = Heads) are two different outcomes. So the correct sample space is {HH, HT, TH, TT} = 4 outcomes.
3. What is Gambler's Fallacy?
The Gambler's Fallacy is the false belief that if a random event has occurred many times in a row, the opposite is due to happen. For example, if a coin shows Heads 5 times in a row, people wrongly assume Tails is more likely next time.
4. How many face cards does a deck of 52 cards have?
There are 12 face cards in a standard deck: Jack, Queen, and King of each of the 4 suits = 4 × 3 = 12.
5. What is a tree diagram in probability?
A tree diagram is a branching visual tool used to list all possible outcomes of a multi-stage random experiment. You should use it whenever the experiment has two or more steps.
6. What does P(E) = 0 or P(E) = 1 mean?
P(E) = 0 means the event is impossible; it can never happen. Example: Getting 7 on a roll of a standard die. P(E) = 1 means the event is certain; it will always happen.
Numbers make sense when they're taught right. To see how Orchids The International School turns Maths from intimidating to intuitive, reach out to our admissions team.
Admissions Open for 2026-27
What type of concept pages would you prefer?
CBSE Schools In Popular Cities
- CBSE Schools in Bangalore
- CBSE Schools in Mumbai
- CBSE Schools in Pune
- CBSE Schools in Hyderabad
- CBSE Schools in Chennai
- CBSE Schools in Gurgaon
- CBSE Schools in Kolkata
- CBSE Schools in Indore
- CBSE Schools in Sonipat
- CBSE Schools in Delhi
- CBSE Schools in Rohtak
- CBSE Schools in Bhopal
- CBSE Schools in Aurangabad
- CBSE Schools in Jabalpur
- CBSE Schools in Jaipur
- CBSE Schools in Jodhpur
- CBSE Schools in Nagpur
- CBSE Schools in Ahmednagar
- CBSE School In Tumkur


Orchids The International School is one of India's leading chains of CBSE and ICSE schools, with 130+ schools across the country.